
New Research Quantifies Benefits of Proposed Indian Water Efficiency Standard
Increasing the water efficiency of taps and showerheads in India would avoid massive carbon dioxide emissions, in addition to reducing water stress during an ongoing crisis, new CLASP research has found.
Plumbing fixtures that efficiently deliver water without wasting too much of the precious resource are an underutilized tool in mitigating climate change. Water efficiency policies can dramatically reduce hot water demand, and thus the energy used for water heating. Because they dispense large volumes of hot water, faucets and showerheads represent the largest opportunity for carbon avoidance from water fixtures.
In India, government projections show that water availability per capita will decline 13% between 2011 and 2025. While only 58% of households have individual access to piped water, the ongoing water crisis – compounded by rapid population growth and competing water uses – makes water efficiency an important means to reduce both water stress and climate emissions.
Recent research by CLASP, with partner Environmental Design Solutions, investigated the climate potential from water efficiency policy adoption in India. We analysed the existing policy and institutional environment, along with opportunities to introduce water efficiency policies and barriers to adoption.
Currently, the Bureau of Indian Standards (BIS) is developing a draft national policy for water fittings that would encompass taps and showerheads. Our analysis found that the policy would avoid 71 MT of CO₂ emissions and reduce water consumption by 7 trillion liters annually – enough to fill 2.8 million Olympic-sized swimming pools. The new report also recommends next steps in policy development, including the review of other relevant codes and regulations.
CLASP’s India report was developed following a global scoping study on water efficiency that ranks countries by the scale of climate impact potential and level of domestic focus, reflecting factors such as typical hot water consumption, pressure on water resources, and projected population change. Based on the global study, CLASP conducted in-depth assessments in India, Brazil, and South Africa.
Read more about CLASP’s support for efficiency policies for televisions and air compressors in India, developments in air conditioner policy adoption in Brazil, and our engagement on appliance efficiency in South Africa.
In-depth Assessment of Water Efficiency Opportunities in India
In India, only 58% of households have access to piped water in the dwelling and the government predicts that annual average water availability per capita will decline 13% between 2011 and 2025. The ongoing water crisis, compounded by rapid population growth and competing water uses, would benefit from water efficiency.
CLASP and local partner Environmental Design Solutions investigated the viability of water efficiency policies in conserving water and mitigating associated carbon emissions from water heating. A draft national policy under development with the Bureau of Indian Standards could avoid 71 MT of CO2 emissions and reduce water consumption by 7 trillion liters annually.
In-depth Assessment of Water Efficiency Opportunities in Brazil
In Brazil, home to 20% of the world’s water supply, a large dependence on hydroelectricity has spurred water shortages and disparate household access. CLASP investigated the viability of introducing water efficiency policies in Brazil that could conserve natural resources and address the climate crisis.
CLASP modeled the potential impacts from water efficiency policies, finding relatively small carbon reductions as just under half of all Brazilian households heat their water. Of those, 97% use electric showers, representing one immediate opportunity for water efficiency policy intervention. The report suggests that greater water conservation could be achieved by including cold water fixtures in water efficiency policies.
In-depth Assessment of Water Efficiency Opportunities in South Africa
In South Africa, the world’s 14th largest emitter of greenhouse gases, an estimated 89% of households have access to water in the dwelling, on site, or via a communal source. As a result of rapid population growth, the country will require 17% more water by 2030 than the quantity available today.
CLASP investigated the opportunity to introduce water efficiency policies in South Africa that could conserve water and avoid associated carbon emissions from water heating. Water efficient faucets and showerheads present an opportunity to conserve natural resources and mitigate associated emissions from coal-based electricity generation. CLASP found that water efficiency policies could reduce South African water use by over 1 trillion liters per year, reducing energy consumption by 18 TWh per year and CO2 emissions by 16 MT per year.
Global Water Efficiency Scoping Study
Seventeen countries that are home to one-fourth of the world’s population are under extremely high water stress, and the climate crisis compounds the problem. Although water is not an explicit component of the Paris Agreement, the United Nations notes that it is “an essential component of nearly all the mitigation and adaptation strategies.”
Over the past year, CLASP assessed the viability of introducing water efficiency policies in the world’s top-18 carbon-emitting economies in the appliances sector, focusing specifically on policies for faucets and showerheads. CLASP ranked each country by the relative urgency and potential for impactful policies based on factors such as hot water consumption, pressure on water resources, and projected population increases. CLASP also assessed the viability of successfully implementing water efficiency policies, based on prerequisites such as existing water or efficiency policies.
New Analyses from CLASP Signal Potential for Water Efficiency Measures to Cut Water Waste & CO₂ Emissions
Seventeen countries that are home to one-fourth of the world’s population are under extremely high water stress, and the climate crisis compounds the problem. Although water is not an explicit component of the Paris Agreement, the United Nations notes that it is “an essential component of nearly all the mitigation and adaptation strategies.”
New CLASP research reveals the opportunity to reduce water consumption while avoiding associated carbon emissions from water heating through water efficiency policies for showerheads and faucets. The reports assess the world’s top carbon-emitting economies and identify three major countries where new or revised policies would have the greatest impact.
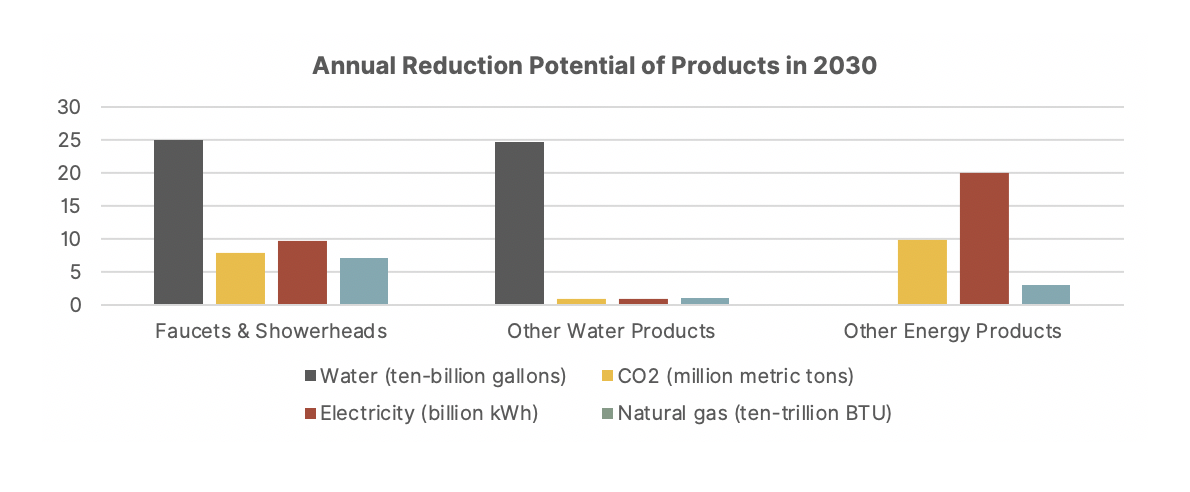
Water efficiency policies dramatically reduce hot water demand, thereby reducing the energy required for water heating. In the United States, water heating accounted for 14% of residential electricity use in 2018, just 3% lower than the electricity used for air conditioning. The expected carbon emissions reductions from faucets and showerheads alone are eight times greater than those from all other water-consuming products combined.
Global Scoping Study
Over the past year, CLASP assessed the viability of introducing water efficiency policies in the world’s top-18 carbon-emitting economies in the appliances sector, focusing specifically on policies for faucets and showerheads. CLASP ranked each country by the relative urgency and potential for impactful policies based on factors such as hot water consumption, pressure on water resources, and projected population increases. CLASP also assessed the viability of successfully implementing water efficiency policies, based on prerequisites such as existing water or efficiency policies.
The study found 13 economies with the potential for high impact from new or updated policies. They are China, the US, India, Brazil, the European Union, Indonesia, Australia, South Africa, Republic of Korea, Thailand, Mexico, Pakistan, Türkiye. Read the Global Scoping study.
After further consideration of the existing policy environments, CLASP prioritized three countries for in-depth assessments: India, Brazil, and South Africa.
India
In India, only 58% of households have access to piped water in the dwelling and the government predicts that annual average water availability per capita will decline 13% between 2011 and 2025. The ongoing water crisis, compounded by rapid population growth and competing water uses, would benefit from water efficiency.
A draft national policy under development with the Bureau of Indian Standards would avoid 71 MT of CO2 emissions and reduce water consumption by 7 trillion liters annually.
South Africa
In South Africa, the world’s 14th largest emitter of greenhouse gases, an estimated 89% of households have access to water in the dwelling, on-site, or via a communal source. As a result of rapid population growth, the country will require 17% more water by 2030 than the quantity available today.
Water efficient faucets and showerheads present an opportunity to conserve natural resources and mitigate associated emissions from coal-based electricity generation. CLASP found that water efficiency policies could reduce South African water use by over 1 trillion liters per year, reducing energy consumption by 18 TWh per year and CO2 emissions by 16 MT per year.
Read the South Africa assessment.
Brazil
In Brazil, home to 20% of the world’s water supply, a large dependence on hydroelectricity has spurred water shortages and disparate household access. CLASP modeled the potential impacts from water efficiency policies, finding relatively small carbon reductions as just under half of all Brazilian households heat their water. Of those, 97% use electric showers, representing one immediate opportunity for water efficiency policy intervention. The report suggests that greater water conservation could be achieved by including cold water fixtures in water efficiency policies.
Virtual Office, Real CO₂ Reductions
This article is the second in a series where CLASP takes up emerging topics in climate and energy access; written by Stephen Pantano, CLASP Chief Research Officer.
It has now been nearly four months since the CLASP team began working full-time from home and the organization instituted a travel moratorium in response to COVID-19. By now we, like most of the world, have grown accustomed to our virtual offices and the challenges of conducting business via video conference. In light of our mission to mitigate climate change, we wondered: What are the climate impacts of these recent changes in our work habits?
To answer this question, we calculated our collective greenhouse gas (GHG) emissions and compared them to a business as usual scenario. We conducted an informal survey of our team of 49 full-time team members around the world. About two thirds of us are based in Washington, DC, while others are spread across Belgium, India, Indonesia, Kenya, and the United Kingdom. In this article, we detail our findings in three specific areas: changes in commuting patterns; home versus office building energy use; and restrictions on air travel. Overall, we find that working from home leads to nearly zero change in our net GHG emissions from heating and cooling. Meanwhile there are substantial GHG benefits from reduced transportation, especially international air travel.
Commuting
There is ample evidence that working from home has net benefits in terms of reduced energy use and air pollution reductions from transportation. A recent study from India found that the National Air Quality Index value improved by more than 60% during India’s national lockdown, which began at the end of March, with the biggest improvements in PM10 and PM2.5 pollutants. Road traffic contributes about 30% of total particulate matter pollution in the Delhi region, so changes in travel and transportation have undoubtedly made substantial contributions to air quality improvements.
The International Energy Agency (IEA) has reported that “in April, with around one-third of the global population in complete lockdown, gasoline use dropped by more than 9 million barrels a day and demand for diesel was down by 6 million barrels a day,” leading to 65 to 95% reductions in rush hour traffic congestion and substantial improvements in air pollution. The same IEA study concluded that “during an average year, the overall energy saved as a result of less commuting is still around four times larger than the increase in residential energy consumption.”
The average person commutes 3.8 days per week, 8.2 miles each way to CLASP’s Washington office. Commutes range from a half-mile walk to a 40-mile combination of car, commuter rail, and subway. GHG emissions factors for each mode of transit were compiled from a variety of sources, including transit provider data. Where specific information was not available, we developed estimates based on other sources and modified to better reflect local conditions (e.g., DC electric grid carbon intensity).
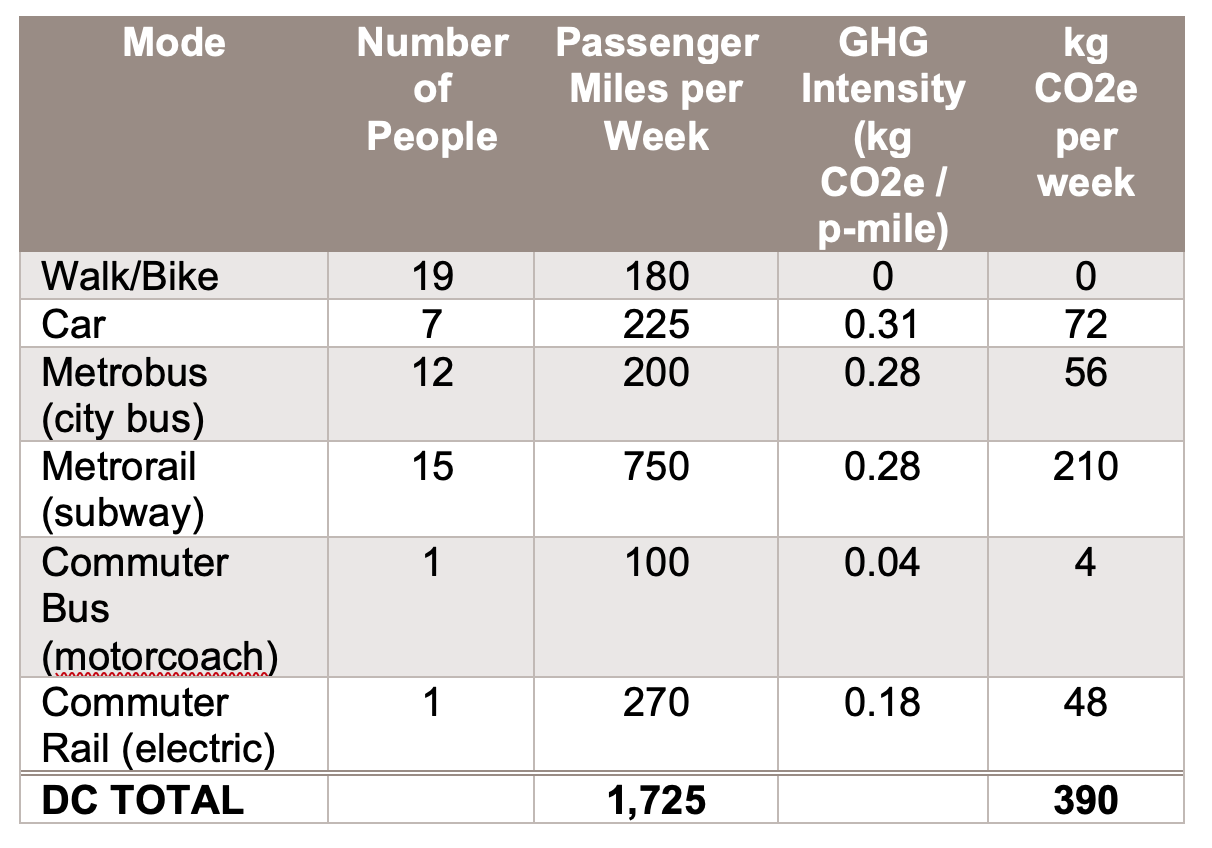
Our 90 thousand annual commuting miles in the DC metropolitan area contribute GHG emissions of about 20 MtCO₂e per year, less than the total annual emissions from five passenger vehicles. Our real impact is probably a bit less than this given the large proportion of Metrorail (subway) travel versus Metrobus, but we couldn’t find information with which to calculate separate emissions factors for each mode.
CLASP’s Nairobi office has slightly more days in the office (4.4 vs. 3.8) but a shorter average distance (5.3 miles each way vs. 8.2 miles). There are no rail transit options available in Nairobi, so commutes are comprised of the following:
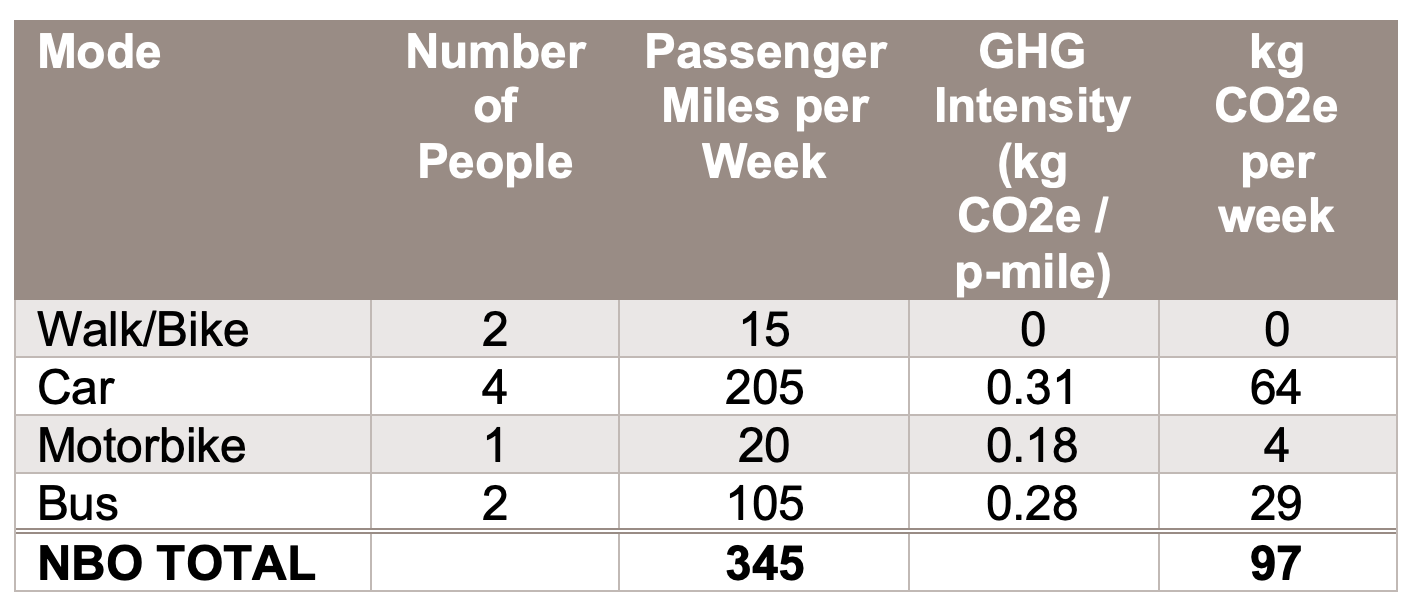
Commutes in Nairobi add a minimum of 0.5 Mt CO₂e per year to CLASP’s tally, though this is a conservative estimate. Actual emissions are likely to be higher because of increased traffic congestion and the age of the vehicle stock in Kenya, where vehicles are on average about 25% older than in the US. The traffic burden in Nairobi is estimated to be nearly 40% worse than that of Washington, DC based on actual travel times. Traffic congestion has a detrimental effect on vehicle CO₂ emissions; according to one study, increasing average vehicle speeds from 15 to 25 MPH reduces up to 30% of CO₂ emissions.
In Delhi, our team commutes on average 5 days per week, an average of 6.6 miles each way via car, CNG three-wheeler, and motorbike.
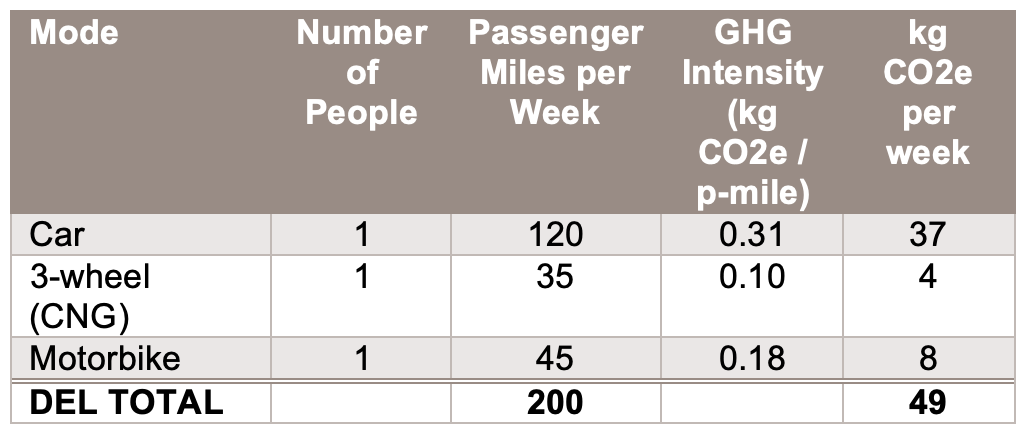
Commuting in Delhi adds a minimum of 0.2 Mt CO₂e per year to CLASP’s tally, though this is also a conservative estimate. Actual emissions are likely to be higher because of increased traffic congestion in Delhi, where the traffic burden is estimated to be nearly 50% worse than that of Washington, DC based on actual travel times.
Home vs. Office Energy Use
Residential impacts are driven primarily by changes in daytime heating and cooling energy plus additional electricity use for lighting and computer equipment. These impacts are somewhat offset by reductions in heating, cooling, and electrical loads in our office buildings—provided the office space is managed well. A few organizations have done similar studies of home and office electricity use impacts since the start of stay-at-home orders:
- In Austin, Texas, researchers at the Pecan Street project found a 20% increase in residential energy use from March to April, compared to the past three years, across 113 metered residences. As work became remote, the shape of the typical load curve leveled out over the course of the day—no longer dipping in the afternoon as a result of changes in air conditioner (AC) settings and other appliance usage. AC use increased more than expected given the outdoor temperatures over the period, and refrigerator use increased dramatically. Researchers hypothesize this is due to more frequent openings of the fridge door and because residents were cooking more frequently at home and putting warm leftovers into the fridge more than usual.
- Analysts at Uplight examined both residential and commercialenergy consumption patterns, finding combined net system usage and peak load decreases of 4 to 8%. Much like Pecan Street, they found a 20 to 30% increase in total residential consumption and a 21 to 35% increase in residential peak loads across 700,000 homes. Uplight’s analysis showed a corresponding 15 to 19% reduction in total commercial consumption and a 13 to 22% decrease in commercial peak loads. The impacts across commercial building types varied considerably – non-essential business saw the greatest declines while essential services like healthcare only saw a consumption decrease of 6%, while office buildings (our domain at CLASP) saw mean consumption decrease by 18%.
These are just two examples from the United States, but similar patterns may be expected in other industrialized countries.
The GHG impacts of these electricity usage changes depend upon a wide range of factors. Local climate is one important consideration: regions with high cooling demand may see large increases in mid-day peak demand as residential AC use ramps up on hot summer afternoons. This will be offset somewhat by decreases in commercial space cooling demand – but offices and retail will likely be fully conditioned even with limited occupancy. The local grid electricity mix is another important factor, though it is anyone’s guess how current market dynamics will affect the competitiveness of renewable energy versus fossil fuels. For every article about the climate threat to clean energy, there’s another that points to the increasing strength of solar and wind. Renewable energy may be outpacing coal in the US and UK under the current conditions, but utilities still remain dependent upon fossil fuel, as evidenced by PG&E’s plan to use 450 MW of diesel generation to support critical facilities this coming summer.
Heating and Cooling
The CLASP team began working from home on March 16, at the tail end of a mild winter in the US mid-Atlantic region. Our home offices span a mix of building styles. In the greater Washington region, about 20% of the team lives in an attached townhouse, 40% in an apartment, and 40% in detached single-family homes. Most of our residences are heated primarily with natural gas, while a few use electric heat pumps. In the month of March, our team reported an average electricity consumption of 522 kWh, gas consumption of 58 therms (1700 kWh).
12 people reported setting their thermostats back by 3.5 degrees over 6 hours during the daytime, to an average of 65.8 F (18.8 C). A recent study found that a 3-degree daytime setback could save 11% of heating energy, which means that if we are overriding our setbacks while working from home, heating energy use would rise by a corresponding amount. In the mid-Atlantic region, it is estimated that 13% of residential electricity and 71% of residential gas consumption is for space heating, so an energy increase of 10% equates to 7 kWh of electricity and 4 therms of natural gas per household per month. Across 34 Washington-area households, this equates to a monthly GHG impact of 47 kg CO₂e for electricity (using DC emissions factors from eGRID = 0.199 kg CO₂e/kWh), and 336 kg CO₂e for natural gas (using E3 assumptions of 2.8% methane leakage).
In Nairobi, the situation is a bit different. The subtropical highland climate requires much less heating and cooling for comfort compared to Washington’s humid subtropical climate. Two thirds of the Nairobi team live in apartments and one third in townhouses or detached homes. The primary heating source was identified as “the sun,” and as you would expect with no heating loads the average monthly electricity consumption was much less at 160 kWh. Comparing total energy consumption from both natural gas and electricity, we find that our homes in Nairobi consume 90% less energy than homes in Washington. Given that per capita emissions of CO₂ are 53 times higher for Americans than they are for Kenyans, this doesn’t come as much of a surprise.
In Delhi, the climate is an overlap between monsoon-influenced humid subtropical and semi-arid. The period of lockdown coincided primarily with the hot, dry pre-monsoon season. Our Delhi team noted a modest increase in home energy usage in March, April, and May, with a more substantial increase in electricity consumption beginning in June with additional air conditioner usage. The average electricity consumption for the month of May was 570 kWh, roughly equivalent to the average consumption in Washington, DC.
Lighting & Appliances
Unlike heating and cooling, climate impacts from lighting and appliances are minimal and are consistent across CLASP’s office locations. Everyone uses the same laptop computer whether at home or in the office, and almost everyone on the team reports using efficient LED lighting throughout their home. Home offices only require a few watts of additional task lighting during business hours. We have provided many people on the team with second computer monitors but selected an efficient 15-inch portable monitor that consumes an average of about 8 watts. This is a net reduction from our 24-inch office monitors, which consume upwards of 20 watts.
Office Energy Reductions
We received monthly electricity consumption data for our Washington, DC office: a 12-story, 125,000 square foot office building originally constructed in 1929. CLASP leases 5,780 square feet across two partial floors, or 4.6% of the available space.
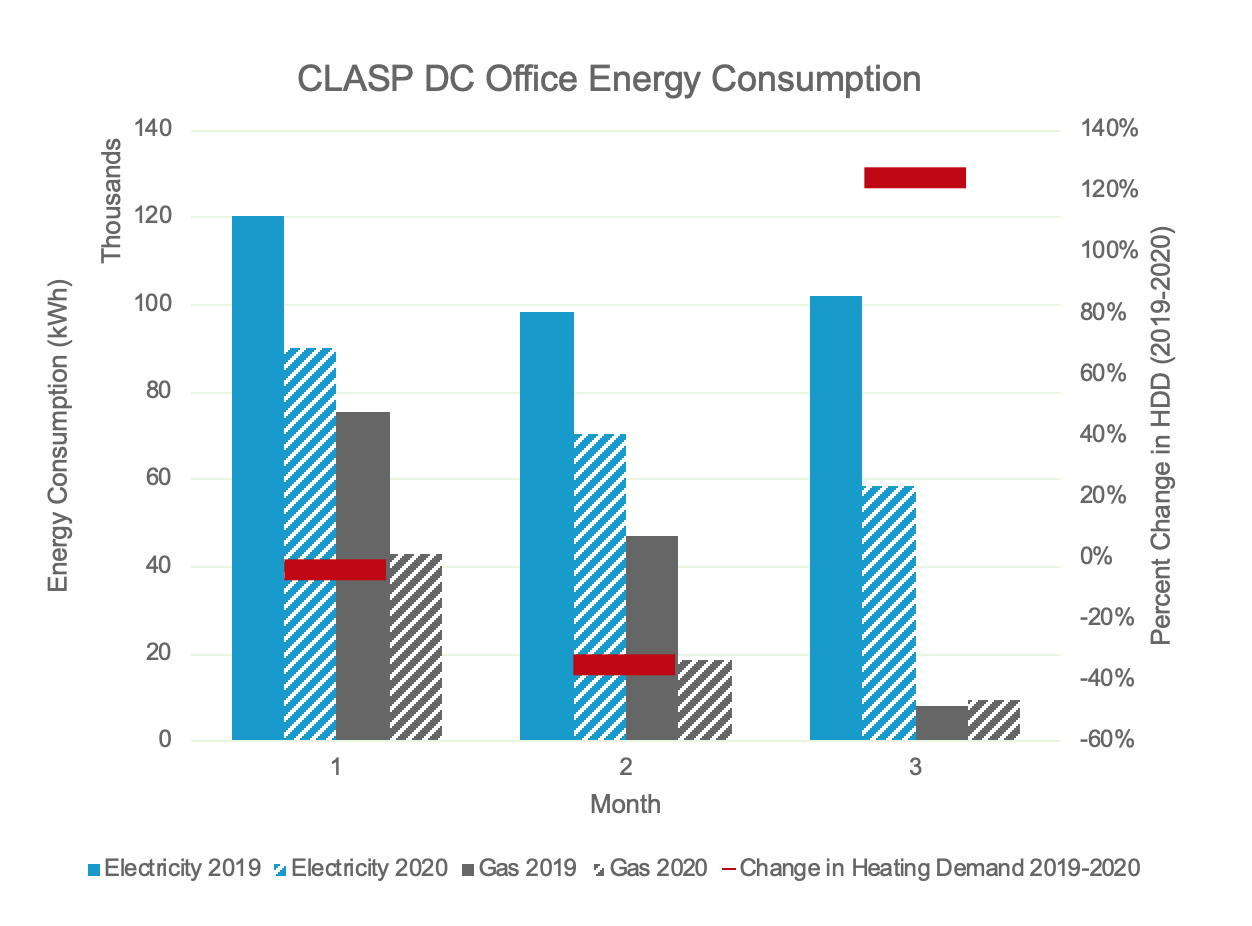
Electricity consumption has decreased as lockdowns have continued and offices have remained empty. The net electricity reductions for CLASP’s portion of the building work out to 1,380 kWh for February, 1,280 kWh for March, and 2,002 kWh for April. Using a 0.199 kg CO₂e/kWh electricity emissions factors from eGRID, this equates to a GHG emissions reduction of 928 kg CO₂e over a 3-month period.
Office building gas consumption has also decreased substantially, in each case. Even with higher heating demand in April 2020 versus April 2019, gas usage has been less than would be predicted by weather differences. Accounting for differences in heating degree days (HDD), the net gas reductions for CLASP’s portion of the building works out to 48 therms in February, 29 in March, and 6 in April. Assuming 2.8% methane leakage from natural gas distribution, this equates to a GHG savings of 204 kg CO₂e over a 3-month period.
Air Travel
Air travel, a significant contributor to global warming, is another important sector that has been heavily disrupted by COVID-19. Flying emits carbon emissions from fuel combustion plus the additional radiative forcing effects of particulate emissions at high altitudes. The research group OAG Aviation notes that in mid-May, air travel was down more than 70% compared to the same time last year.
International air travel was a big part of pre-lockdown life at CLASP; our top travelers exceed 15 trips and 100,000 miles per year. Based on our survey, we estimate the average CLASP team member travels about 33,000 miles per year. Using the UK government’s table of GHG equivalencies, we find that the average international long-haul flight in premium economy class generates 0.359 kg CO₂e per passenger mile, while economy class delivers 0.224 kg CO₂e per passenger mile. Assuming 50% of travel is in economy class and 50% in premium economy, we calculate that CLASP’s 1.6 million miles of air travel generated 466 MT CO₂e in 2019, equivalent to average per capita emissions of 28 people in the US.
While travel has long been an indispensable part of our work at CLASP – for example, to attend important appliance standards review meetings – the magnitude of the GHG impacts highlights the additional climate benefits that come from working with a global team and local partners. Although we purchased about three years’ worth of carbon offsets from Gold Standard in 2019 to counter these impacts, and our travel moratorium instituted on February 26 has avoided at least 150 MT of emissions already this year, project delivery through local teams will always be better than long-haul flights from an emissions perspective.
In Summary
Looking across these many additions and subtractions to our climate impacts, how does it all add up? The following table summarizes the major contributions for our Washington, DC headquarters, for which we have the most complete picture:
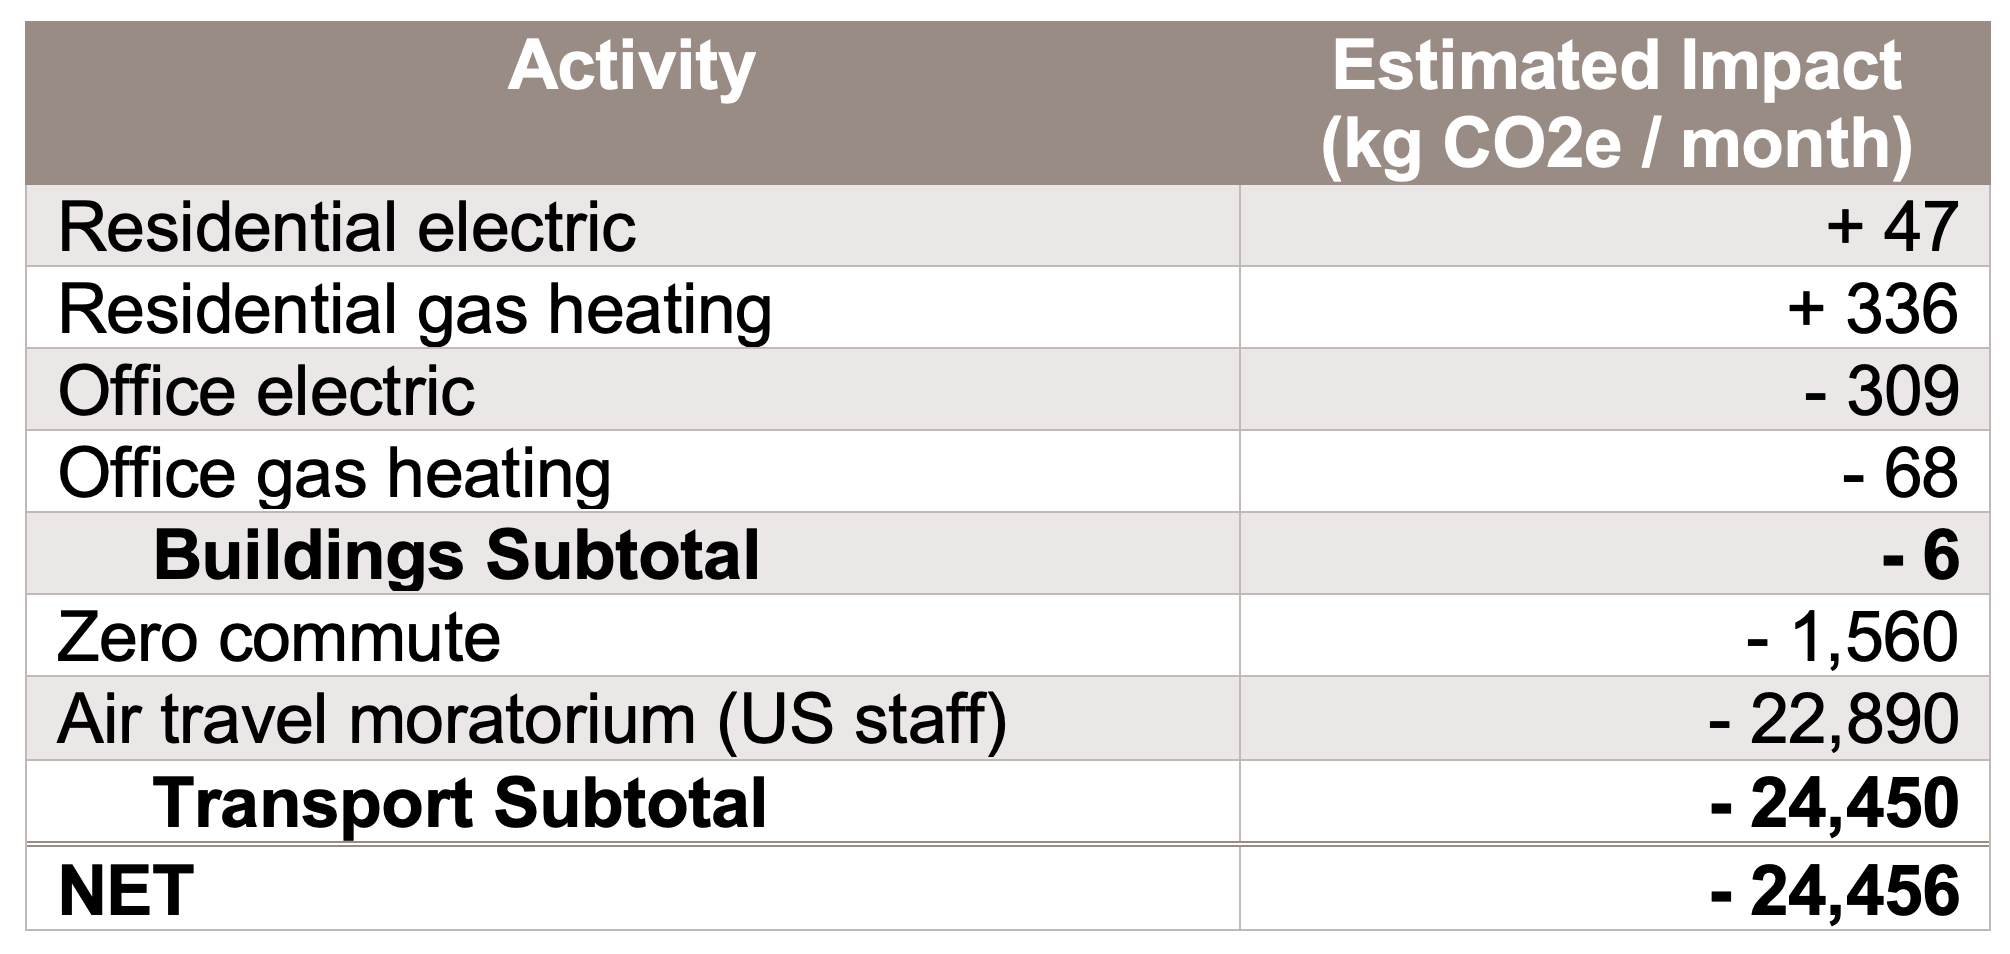
Our informal survey yielded preliminary information that shows minimal (nearly zero) impact from the recent transition to remote work, in terms of building-sector GHG emissions. These are only rough estimates which we can refine over time by collecting time-series energy meter data. It will be interesting, for example, to see how residential energy consumption changes as we head into the summer cooling season in Washington, the hot and humid monsoon of Delhi, and the mild winter of Nairobi (during which at least one colleague makes occasional use of electric resistance heaters). Further data will show if trends are consistent with some of the larger studies conducted by Pecan Street and others.
Our survey also showed that the GHG impacts of travel are orders of magnitude greater than those from our buildings. Air travel in particular contributes 95% of our total GHG emission! It seems likely that COVID-19 will continue to increase our number of virtual meetings, so air travel is likely to remain minimal.
As local economies begin to open back up and people return to the office, it will also be interesting to observe changes in our commuting patterns. It is likely that more people will choose to drive, walk, or bike rather than board a crowded bus or subway train, and the total number of commuting days to the office will also probably decrease.
We will continue to track these impacts over time, and plan to return to this story in the future. In the meantime, we welcome your comments and perspectives on other impacts we should consider and strategies we can use to reduce CLASP’s overall carbon footprint in the future.
Heating Electrification: The Next Opportunity for Coordinated Climate Action
This article is the first in a series where CLASP takes up emerging topics in climate and energy access; written by Stephen Pantano, CLASP Chief Research Officer.
Recently, some CLASP colleagues and I began engaging with the topic of electrification in the appliance sector. Electrification—which seeks to replace fossil fuel burning appliances with electrically powered alternatives—offers many benefits to consumers, the climate, and the energy grid. We wondered, knowing that electrification is essential to decarbonization, what are the biggest opportunities for global action in the residential appliance sector? What can CLASP and its partners contribute?
Among the opportunities, electric heat pumps are already a proven and widely adopted technology for replacing natural gas, propane, oil, and coal for space heating in major markets around the world. According to IRENA, around 20 million heat pumps were installed globally in 2018, and the number continues to rise. Even without a major global effort to promote research and development (R&D) and further adoption, electrified space heating is cost-effective. However, the market must grow seven-fold by 2030 in order to maximize climate benefits.
There has been a significant amount of attention on cooling in the past 5 years but no parallel global initiative on heating electrification. We believe this is a great opportunity for coordinated action, especially as countries look to supplement their existing climate commitments under the Paris Agreement.
The Opportunity
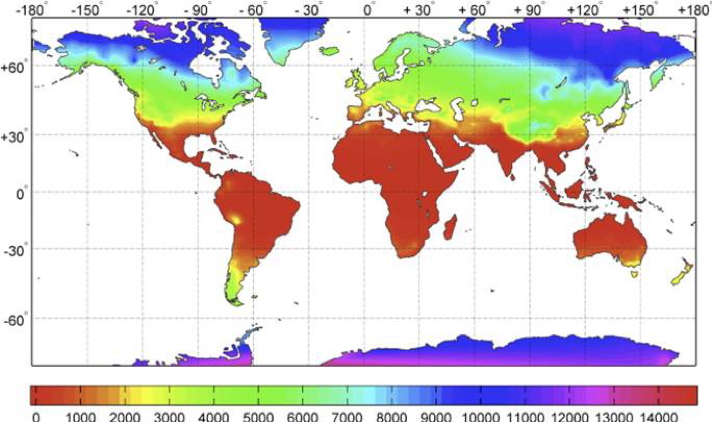
Let’s focus on space and water heating, specifically the opportunity to replace fossil fuel furnaces and boilers with electric air- and ground-source heat pumps. The potential market for heat pump technology coincides with the orange, yellow, and green portions of the map in Figure 1. This area covers most of North America, Europe, and central Asia. Areas represented in red do not require energy for space heating at any time of the year, and those colored blue are too demanding and sparsely populated for our focus.
Climate
Heating electrification presents a substantial opportunity for global progress on appliance energy efficiency and should play a role in many countries’ revised Nationally Determined Contributions and Climate Action Plans under the Paris Agreement. Electrification is a critical step on the path to decarbonizing the buildings sector since it will remove small combustion sources that are distributed throughout homes and commercial buildings today. Tens of millions of gas furnaces, oil boilers, and coal stoves that emit CO2, NOx, and other pollutants are candidates to be replaced with electric heat pumps, paving the way for a transition to greater use of clean, renewable energy for heating.
In the United States, for example, the Rocky Mountain Institute (RMI) found that “moving the US electricity system to power generation that emits zero carbon will only reduce total US emissions 30%. Widespread electrification of buildings, ground transportation, and half of industry would boost reductions to more than 70% if powered by zero-carbon electricity.” Looking globally, the Energy Transitions Commission has estimated that “in the residential and commercial building sector, at least 35% of the energy needs not currently met by electricity could be electrified by 2040 – and there are reasons to believe that the percentage could be significantly higher.”
RMI goes on to say that “the elimination of natural gas distribution has climate benefits beyond the elimination of direct CO2
emissions from combustion. Methane leakage from natural gas distribution (estimated at 2% to 4%) drives 85 times more global warming than CO2
over a 20-year period.”
In the UK, the UK Heat Pump Association
estimates that air source heat pumps reduce heating emissions by more than 60% versus oil and natural gas boilers today, and further technology improvements should lead to a 90% emissions advantage for heat pumps by 2050. Even in locations that use efficient district heating systems, where a central plant provides hot water to multiple buildings through a distribution network, heat pump technology can be employed to further improve efficiency and aid the transition to renewable energy.
The Grid
Widespread heating electrification represents a new flexible and resilient “grid of the future” resource. When deployed alongside other electrification technologies such as electric vehicles and distributed renewables and storage, the collective can fundamentally change the way the grid is managed to improve efficiency and reduce emissions.
Heating loads can be shifted to periods of low demand to reduce peak loads on the grid and enable more effective use of low-carbon renewable energy. The Regulatory Assistance Project notes that “heat pumps can help in managing system demand by preheating or precooling a space during the afternoon and running less during early evening peak periods. Smart thermostats can also enable demand response programs whereby a utility can reduce the electric load of a group of heat pumps by an individually small amount that cumulatively provides a measurable peak load reduction benefit to the grid and avoids unnecessary air emissions.”
Consumers
Heat pumps are simply one of the most efficient technologies available for space and water heating today and further adoption serves to benefit consumers. Whereas a high efficiency gas furnace may convert 90% of the available energy into usable heat, a heat pump may deliver 4 to 5 times better energy performance. Heat pumps also provide benefits in the warmer seasons, since the same piece of technology can also serve as a more efficient replacement for an air conditioner. These improvements precipitate direct cost savings for consumers, especially in locations where fossil fuel prices are high and where the incumbent technology is old and inefficient. Consumer savings can accrue further if the electric utility offers time of use rates, since a portion of space heating demand (and most water heating demand) can often be shifted preferentially to times with lower electricity rates.
Taking Action
So what can be done to spark and further an electrification effort for heating, especially as we prepare for next year’s Climate Summit?
First, we can rally coordinated action among governments, financiers, private sector companies, and philanthropies. There are models for cooperation in the cooling sector that we can draw from; groups like the Kigali Cooling Efficiency Program and the Cool Coalition are taking on the challenge of growing GHG emissions from accelerating cooling demand around the world with broad stakeholder support. A similar effort can and should be organized for heating, with the objective of raising the international profile of the issue, facilitating learning, research and development, and identifying effective policy solutions that can be rolled out quickly and at scale.
Second, we should secure financing for large-scale deployments and support necessary technology research and development. Financing is a proven and effective tool for accelerating heat pump market transformation. In China, for example, a subsidy of $3000 to $4000 per household was offered in several Northern provinces to replace coal furnaces with air source heat pumps. As a result, heat pump sales soared from 39 thousand units in 2015 to 680 thousand units in 2017. Financing must be coupled with consumer education, installer training, and other market support activities to ensure a smooth technology transition. Local market conditions, especially the characteristics of heating systems to be replaced in the existing building stock, must be taken into consideration for market transformation to be successful. In terms of R&D, groups like the IEA Heat Pump Technology Collaboration Program (with 17 member countries) and several manufacturer associations are coordinating R&D to improve energy efficiency and cold climate performance and develop low-GWP refrigerants, among other topics. These efforts can be expanded and accelerated to maximize the rate of technology improvement and drive down costs, reducing the long-term need for subsidies.
Third, we should devise coordinated policy approaches that span appliance efficiency, building codes, and electricity regulations. Efficiency standards are important to ensure that heat pumps deliver strong energy performance; building codes can mandate all-electric heating and cooling to ensure no further fossil fuel appliances are installed, and utility regulations, demand response, and time-of-use pricing schemes can be employed to improve the operating cost of heat pumps versus competing technologies. The UK Heat Pump Association has suggested establishing an emissions standard for delivered heat – a novel policy approach that would provide a distinct advantage to efficient electric heating appliances versus fossil fuel driven alternatives. In the US, municipalities such as Takoma Park, a Maryland suburb of Washington, DC, are exploring policies that would phase out all fossil fuel-based heating appliances within city limits by 2035.
“The time to act on electrification is now, as it presents a climate and health threat, and utilities are moving in the wrong direction, presenting a risk to both ratepayers and shareholders. A new customer is added to the U.S. gas distribution system every minute – more than 400,000 new gas customers per year. U.S. utilities are adding approximately 10,000 miles of new pipelines and replacing 5,600 miles of existing gas mains annually. These new investments are being amortized over the next 30-80 years, long after we need to stop burning fossil fuels,” said Stephanie Greene, Principal, Building Electrification at Rocky Mountain Institute.
Taken together, these actions would generate impactful momentum on this opportunity in the time leading up to the next Climate Summit in Glasgow. CLASP continues to engage on this topic and explore avenues to support the actions above.
BEE and CLASP launch NEEM dashboard to track appliance energy end-use
On 4 September 2019, India’s Bureau of Energy Efficiency (BEE) launched a residential energy use dashboard called National Energy End-use Monitoring (NEEM). Shri Abhay Bakre, Director General, BEE, inaugurated the tool in the presence of other senior dignitaries, making it available for public use.
With ever-rising electricity consumption in India and the increasing number of appliances, data on residential energy end-use and appliance energy consumption at the household level are critical for developing better electricity demand projections and related strategies for curbing energy consumption.
Speaking at the event, Shri Abhay Bakre, Director General, Bureau of Energy Efficiency, said, “It gives us immense pleasure to launch the NEEM dashboard. It is a comprehensive platform to collect and analyze data on energy end-use and appliance energy consumption at the household level. Such data will help assess the existing policies and plan for future policymaking. The dashboard is a valuable tool for researchers, policymakers, power distribution companies, academia and others involved in designing energy policies and furthering research.”
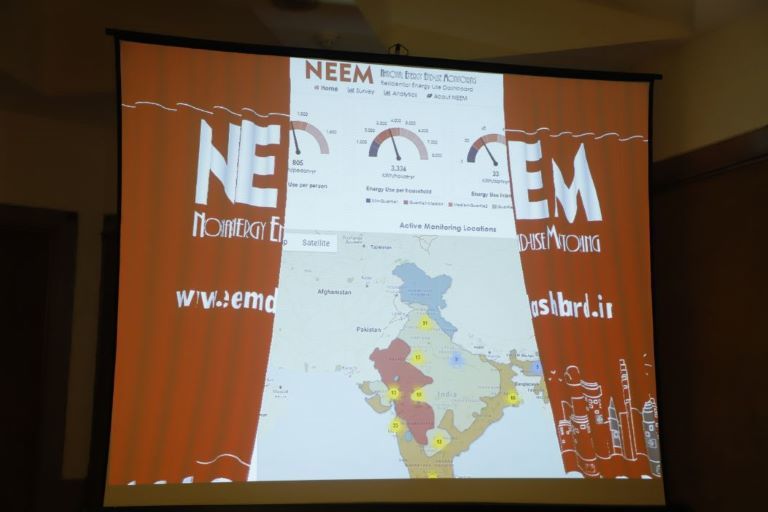
The NEEM dashboard integrates data from a first of its kind survey of residential electricity consumption of 5,000 households, combined with real-time metering of appliance energy use of 200 households, representing various socio-economic classes and climatic zones in India. BEE conducted this analysis in partnership with CLASP and its partners Environmental Design Solutions, Market Xcel and Zenatix.
These data help establish more accurate end-use consumption and usage patterns, which inform energy policy development, impact assessment, and consumer-facing strategies for reducing energy consumption. The dashboard presents information on energy use, peak demand and other performance metrics across time that may be customized based on geography, climate and household type.
The online tool will help address the existing data gap and work toward a roadmap for future policy development and interventions. This dashboard displays live energy use of all the monitored households across India as well as findings from detailed household-level survey on appliance use.
“BEE, CLASP and our partners are working to bridge the gap on availability of end-user data on energy. By integrating both survey-based and real-time data, our objective was to obtain a realistic end-use baseline for robust energy efficiency policies and assess the potential impact of these policies. This initiative needs to be continued to enhance the existing database and monitor the trends,” said Dr Archana Walia, Director, CLASP India.
India’s Bureau of Energy Efficiency Releases Video about the Benefits of Star Labeled Appliances
Consumer awareness on cost and energy savings through energy efficient appliances and equipment has been accorded highest priority by India’s Bureau of Energy Efficiency (BEE). BEE’s new video, which was created with support from CLASP and Riverbank Studios, is one endeavor under the BEE Standards and Labeling outreach initiative to engage and inform consumers on benefits of Star Labeled appliances.
The India’s appliance energy efficiency policy program launched in 2006 with the objective of promoting the production of efficient appliances and equipment and facilitating informed decision making for consumers. The program is intended to reduce the energy consumption of appliances without diminishing the services they provide to consumers.
CLASP worked with BEE to develop India’s very first voluntary policies for air conditioners and refrigerators, implemented in 2007. Since that time, India’s standards and labeling program has grown tremendously, increasing the number of covered products and the stringency of existing energy performance requirements. 21 products are currently covered by the BEE Standards and Labeling program, including 10 for which it is mandatory.
Watch the video about the benefits of star labeled appliances.