
Virtual Office, Real CO₂ Reductions
News
This article is the second in a series where CLASP takes up emerging topics in climate and energy access; written by Stephen Pantano, CLASP Chief Research Officer.
This article is the second in a series where CLASP takes up emerging topics in climate and energy access; written by Stephen Pantano, CLASP Chief Research Officer.
It has now been nearly four months since the CLASP team began working full-time from home and the organization instituted a travel moratorium in response to COVID-19. By now we, like most of the world, have grown accustomed to our virtual offices and the challenges of conducting business via video conference. In light of our mission to mitigate climate change, we wondered: What are the climate impacts of these recent changes in our work habits?
To answer this question, we calculated our collective greenhouse gas (GHG) emissions and compared them to a business as usual scenario. We conducted an informal survey of our team of 49 full-time team members around the world. About two thirds of us are based in Washington, DC, while others are spread across Belgium, India, Indonesia, Kenya, and the United Kingdom. In this article, we detail our findings in three specific areas: changes in commuting patterns; home versus office building energy use; and restrictions on air travel. Overall, we find that working from home leads to nearly zero change in our net GHG emissions from heating and cooling. Meanwhile there are substantial GHG benefits from reduced transportation, especially international air travel.
Commuting
There is ample evidence that working from home has net benefits in terms of reduced energy use and air pollution reductions from transportation. A recent study from India found that the National Air Quality Index value improved by more than 60% during India’s national lockdown, which began at the end of March, with the biggest improvements in PM10 and PM2.5 pollutants. Road traffic contributes about 30% of total particulate matter pollution in the Delhi region, so changes in travel and transportation have undoubtedly made substantial contributions to air quality improvements.
The International Energy Agency (IEA) has reported that “in April, with around one-third of the global population in complete lockdown, gasoline use dropped by more than 9 million barrels a day and demand for diesel was down by 6 million barrels a day,” leading to 65 to 95% reductions in rush hour traffic congestion and substantial improvements in air pollution. The same IEA study concluded that “during an average year, the overall energy saved as a result of less commuting is still around four times larger than the increase in residential energy consumption.”
The average person commutes 3.8 days per week, 8.2 miles each way to CLASP’s Washington office. Commutes range from a half-mile walk to a 40-mile combination of car, commuter rail, and subway. GHG emissions factors for each mode of transit were compiled from a variety of sources, including transit provider data. Where specific information was not available, we developed estimates based on other sources and modified to better reflect local conditions (e.g., DC electric grid carbon intensity).
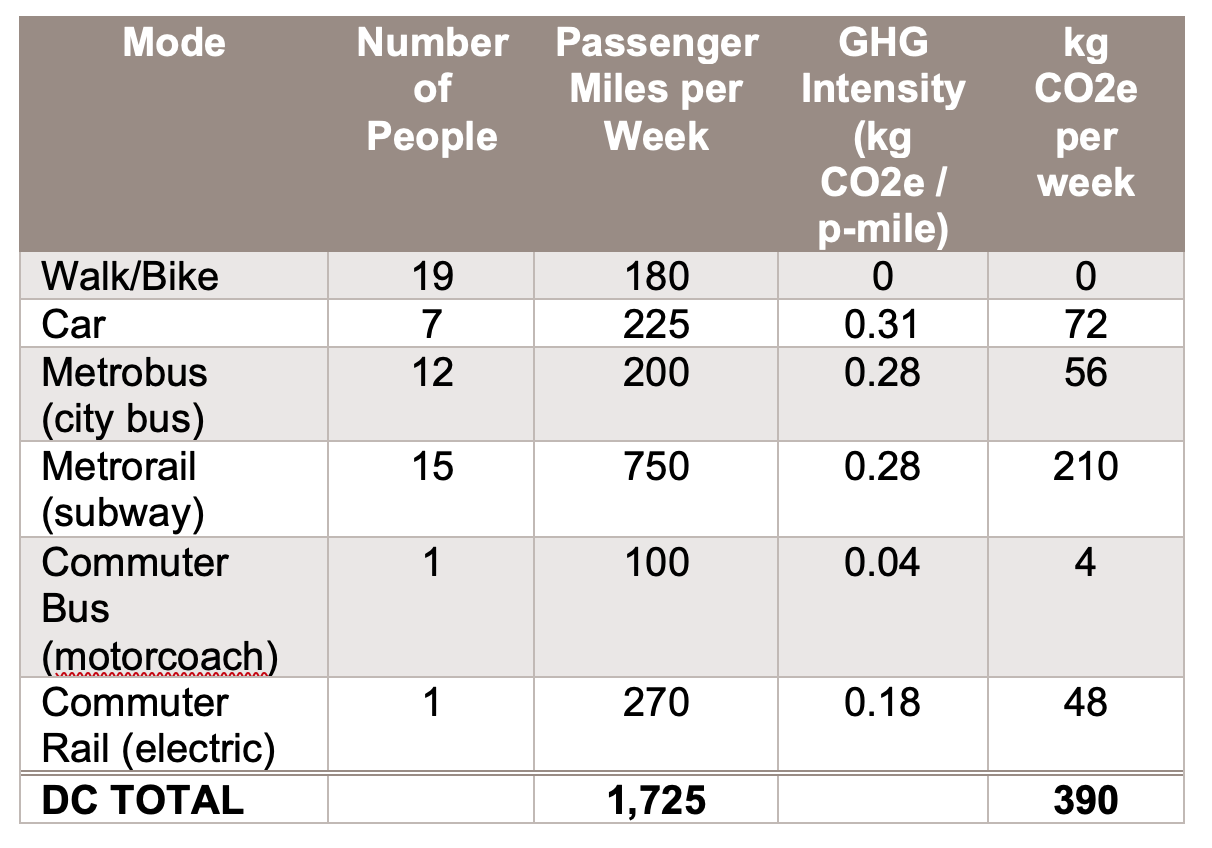
Our 90 thousand annual commuting miles in the DC metropolitan area contribute GHG emissions of about 20 MtCO₂e per year, less than the total annual emissions from five passenger vehicles. Our real impact is probably a bit less than this given the large proportion of Metrorail (subway) travel versus Metrobus, but we couldn’t find information with which to calculate separate emissions factors for each mode.
CLASP’s Nairobi office has slightly more days in the office (4.4 vs. 3.8) but a shorter average distance (5.3 miles each way vs. 8.2 miles). There are no rail transit options available in Nairobi, so commutes are comprised of the following:
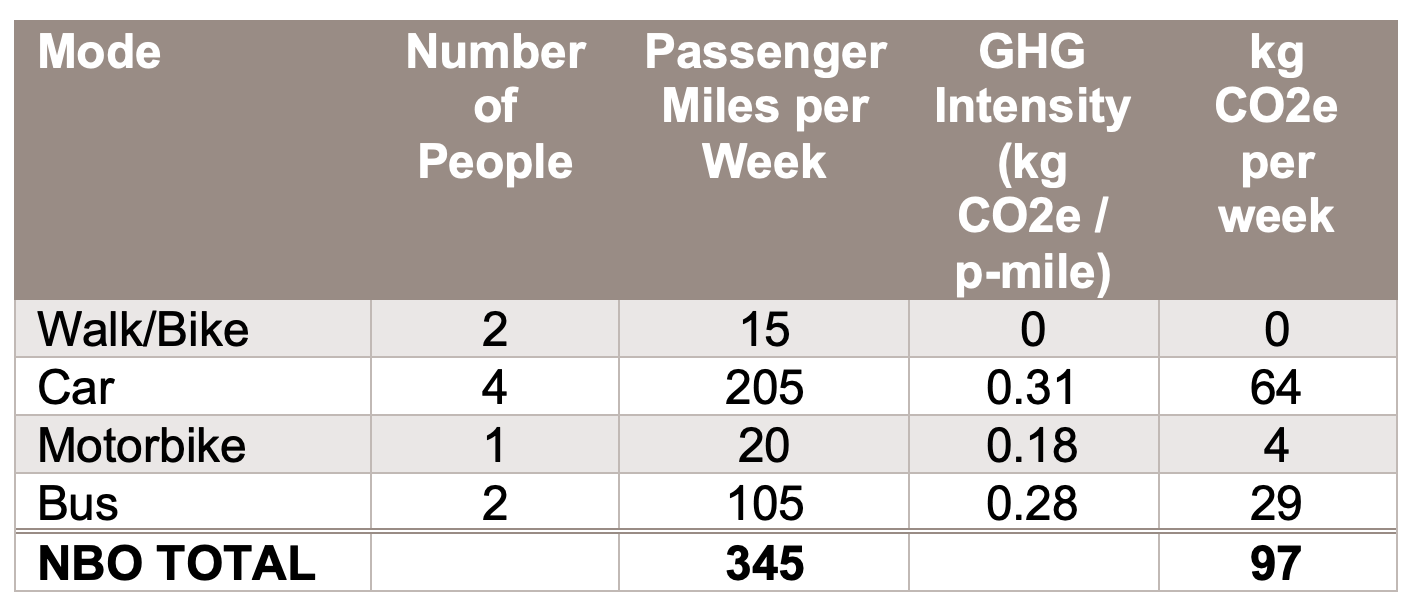
Commutes in Nairobi add a minimum of 0.5 Mt CO₂e per year to CLASP’s tally, though this is a conservative estimate. Actual emissions are likely to be higher because of increased traffic congestion and the age of the vehicle stock in Kenya, where vehicles are on average about 25% older than in the US. The traffic burden in Nairobi is estimated to be nearly 40% worse than that of Washington, DC based on actual travel times. Traffic congestion has a detrimental effect on vehicle CO₂ emissions; according to one study, increasing average vehicle speeds from 15 to 25 MPH reduces up to 30% of CO₂ emissions.
In Delhi, our team commutes on average 5 days per week, an average of 6.6 miles each way via car, CNG three-wheeler, and motorbike.
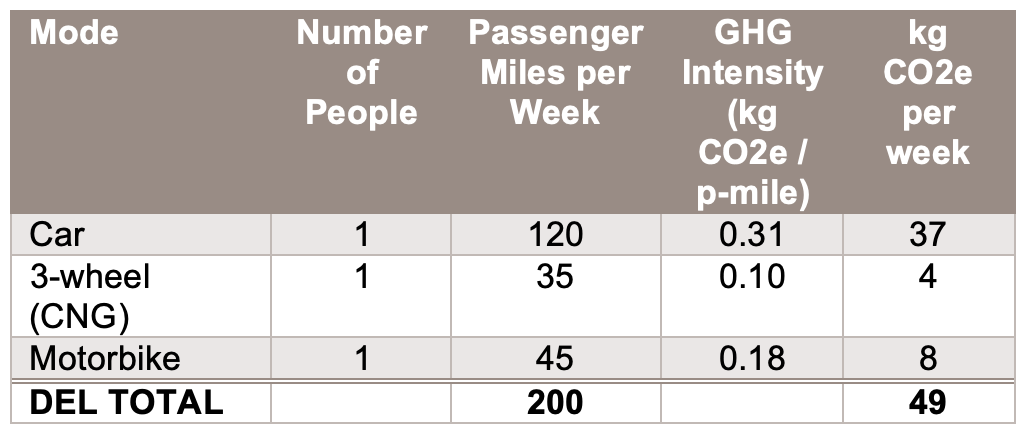
Commuting in Delhi adds a minimum of 0.2 Mt CO₂e per year to CLASP’s tally, though this is also a conservative estimate. Actual emissions are likely to be higher because of increased traffic congestion in Delhi, where the traffic burden is estimated to be nearly 50% worse than that of Washington, DC based on actual travel times.
Home vs. Office Energy Use
Residential impacts are driven primarily by changes in daytime heating and cooling energy plus additional electricity use for lighting and computer equipment. These impacts are somewhat offset by reductions in heating, cooling, and electrical loads in our office buildings—provided the office space is managed well. A few organizations have done similar studies of home and office electricity use impacts since the start of stay-at-home orders:
- In Austin, Texas, researchers at the Pecan Street project found a 20% increase in residential energy use from March to April, compared to the past three years, across 113 metered residences. As work became remote, the shape of the typical load curve leveled out over the course of the day—no longer dipping in the afternoon as a result of changes in air conditioner (AC) settings and other appliance usage. AC use increased more than expected given the outdoor temperatures over the period, and refrigerator use increased dramatically. Researchers hypothesize this is due to more frequent openings of the fridge door and because residents were cooking more frequently at home and putting warm leftovers into the fridge more than usual.
- Analysts at Uplight examined both residential and commercialenergy consumption patterns, finding combined net system usage and peak load decreases of 4 to 8%. Much like Pecan Street, they found a 20 to 30% increase in total residential consumption and a 21 to 35% increase in residential peak loads across 700,000 homes. Uplight’s analysis showed a corresponding 15 to 19% reduction in total commercial consumption and a 13 to 22% decrease in commercial peak loads. The impacts across commercial building types varied considerably – non-essential business saw the greatest declines while essential services like healthcare only saw a consumption decrease of 6%, while office buildings (our domain at CLASP) saw mean consumption decrease by 18%.
These are just two examples from the United States, but similar patterns may be expected in other industrialized countries.
The GHG impacts of these electricity usage changes depend upon a wide range of factors. Local climate is one important consideration: regions with high cooling demand may see large increases in mid-day peak demand as residential AC use ramps up on hot summer afternoons. This will be offset somewhat by decreases in commercial space cooling demand – but offices and retail will likely be fully conditioned even with limited occupancy. The local grid electricity mix is another important factor, though it is anyone’s guess how current market dynamics will affect the competitiveness of renewable energy versus fossil fuels. For every article about the climate threat to clean energy, there’s another that points to the increasing strength of solar and wind. Renewable energy may be outpacing coal in the US and UK under the current conditions, but utilities still remain dependent upon fossil fuel, as evidenced by PG&E’s plan to use 450 MW of diesel generation to support critical facilities this coming summer.
Heating and Cooling
The CLASP team began working from home on March 16, at the tail end of a mild winter in the US mid-Atlantic region. Our home offices span a mix of building styles. In the greater Washington region, about 20% of the team lives in an attached townhouse, 40% in an apartment, and 40% in detached single-family homes. Most of our residences are heated primarily with natural gas, while a few use electric heat pumps. In the month of March, our team reported an average electricity consumption of 522 kWh, gas consumption of 58 therms (1700 kWh).
12 people reported setting their thermostats back by 3.5 degrees over 6 hours during the daytime, to an average of 65.8 F (18.8 C). A recent study found that a 3-degree daytime setback could save 11% of heating energy, which means that if we are overriding our setbacks while working from home, heating energy use would rise by a corresponding amount. In the mid-Atlantic region, it is estimated that 13% of residential electricity and 71% of residential gas consumption is for space heating, so an energy increase of 10% equates to 7 kWh of electricity and 4 therms of natural gas per household per month. Across 34 Washington-area households, this equates to a monthly GHG impact of 47 kg CO₂e for electricity (using DC emissions factors from eGRID = 0.199 kg CO₂e/kWh), and 336 kg CO₂e for natural gas (using E3 assumptions of 2.8% methane leakage).
In Nairobi, the situation is a bit different. The subtropical highland climate requires much less heating and cooling for comfort compared to Washington’s humid subtropical climate. Two thirds of the Nairobi team live in apartments and one third in townhouses or detached homes. The primary heating source was identified as “the sun,” and as you would expect with no heating loads the average monthly electricity consumption was much less at 160 kWh. Comparing total energy consumption from both natural gas and electricity, we find that our homes in Nairobi consume 90% less energy than homes in Washington. Given that per capita emissions of CO₂ are 53 times higher for Americans than they are for Kenyans, this doesn’t come as much of a surprise.
In Delhi, the climate is an overlap between monsoon-influenced humid subtropical and semi-arid. The period of lockdown coincided primarily with the hot, dry pre-monsoon season. Our Delhi team noted a modest increase in home energy usage in March, April, and May, with a more substantial increase in electricity consumption beginning in June with additional air conditioner usage. The average electricity consumption for the month of May was 570 kWh, roughly equivalent to the average consumption in Washington, DC.
Lighting & Appliances
Unlike heating and cooling, climate impacts from lighting and appliances are minimal and are consistent across CLASP’s office locations. Everyone uses the same laptop computer whether at home or in the office, and almost everyone on the team reports using efficient LED lighting throughout their home. Home offices only require a few watts of additional task lighting during business hours. We have provided many people on the team with second computer monitors but selected an efficient 15-inch portable monitor that consumes an average of about 8 watts. This is a net reduction from our 24-inch office monitors, which consume upwards of 20 watts.
Office Energy Reductions
We received monthly electricity consumption data for our Washington, DC office: a 12-story, 125,000 square foot office building originally constructed in 1929. CLASP leases 5,780 square feet across two partial floors, or 4.6% of the available space.
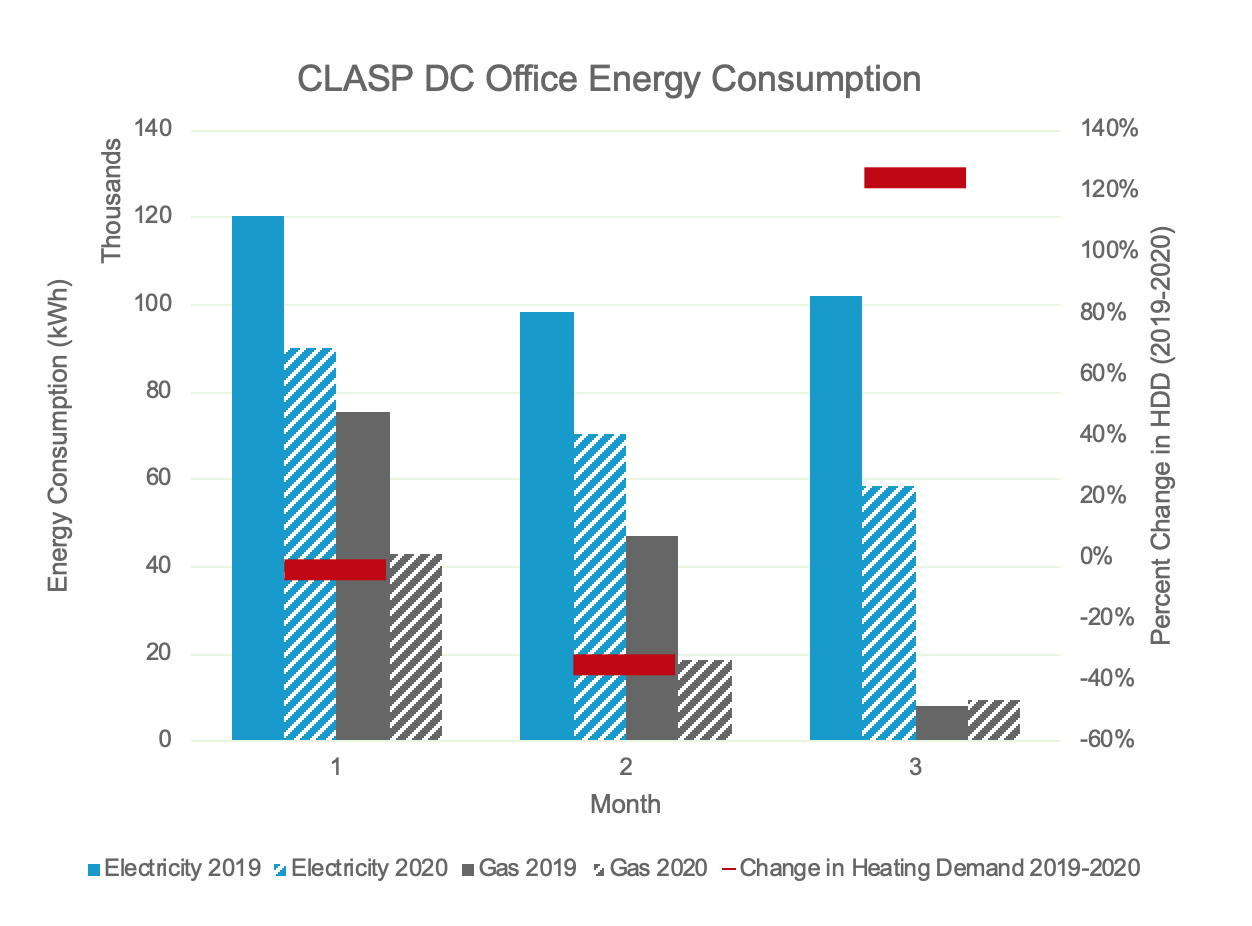
Electricity consumption has decreased as lockdowns have continued and offices have remained empty. The net electricity reductions for CLASP’s portion of the building work out to 1,380 kWh for February, 1,280 kWh for March, and 2,002 kWh for April. Using a 0.199 kg CO₂e/kWh electricity emissions factors from eGRID, this equates to a GHG emissions reduction of 928 kg CO₂e over a 3-month period.
Office building gas consumption has also decreased substantially, in each case. Even with higher heating demand in April 2020 versus April 2019, gas usage has been less than would be predicted by weather differences. Accounting for differences in heating degree days (HDD), the net gas reductions for CLASP’s portion of the building works out to 48 therms in February, 29 in March, and 6 in April. Assuming 2.8% methane leakage from natural gas distribution, this equates to a GHG savings of 204 kg CO₂e over a 3-month period.
Air Travel
Air travel, a significant contributor to global warming, is another important sector that has been heavily disrupted by COVID-19. Flying emits carbon emissions from fuel combustion plus the additional radiative forcing effects of particulate emissions at high altitudes. The research group OAG Aviation notes that in mid-May, air travel was down more than 70% compared to the same time last year.
International air travel was a big part of pre-lockdown life at CLASP; our top travelers exceed 15 trips and 100,000 miles per year. Based on our survey, we estimate the average CLASP team member travels about 33,000 miles per year. Using the UK government’s table of GHG equivalencies, we find that the average international long-haul flight in premium economy class generates 0.359 kg CO₂e per passenger mile, while economy class delivers 0.224 kg CO₂e per passenger mile. Assuming 50% of travel is in economy class and 50% in premium economy, we calculate that CLASP’s 1.6 million miles of air travel generated 466 MT CO₂e in 2019, equivalent to average per capita emissions of 28 people in the US.
While travel has long been an indispensable part of our work at CLASP – for example, to attend important appliance standards review meetings – the magnitude of the GHG impacts highlights the additional climate benefits that come from working with a global team and local partners. Although we purchased about three years’ worth of carbon offsets from Gold Standard in 2019 to counter these impacts, and our travel moratorium instituted on February 26 has avoided at least 150 MT of emissions already this year, project delivery through local teams will always be better than long-haul flights from an emissions perspective.
In Summary
Looking across these many additions and subtractions to our climate impacts, how does it all add up? The following table summarizes the major contributions for our Washington, DC headquarters, for which we have the most complete picture:
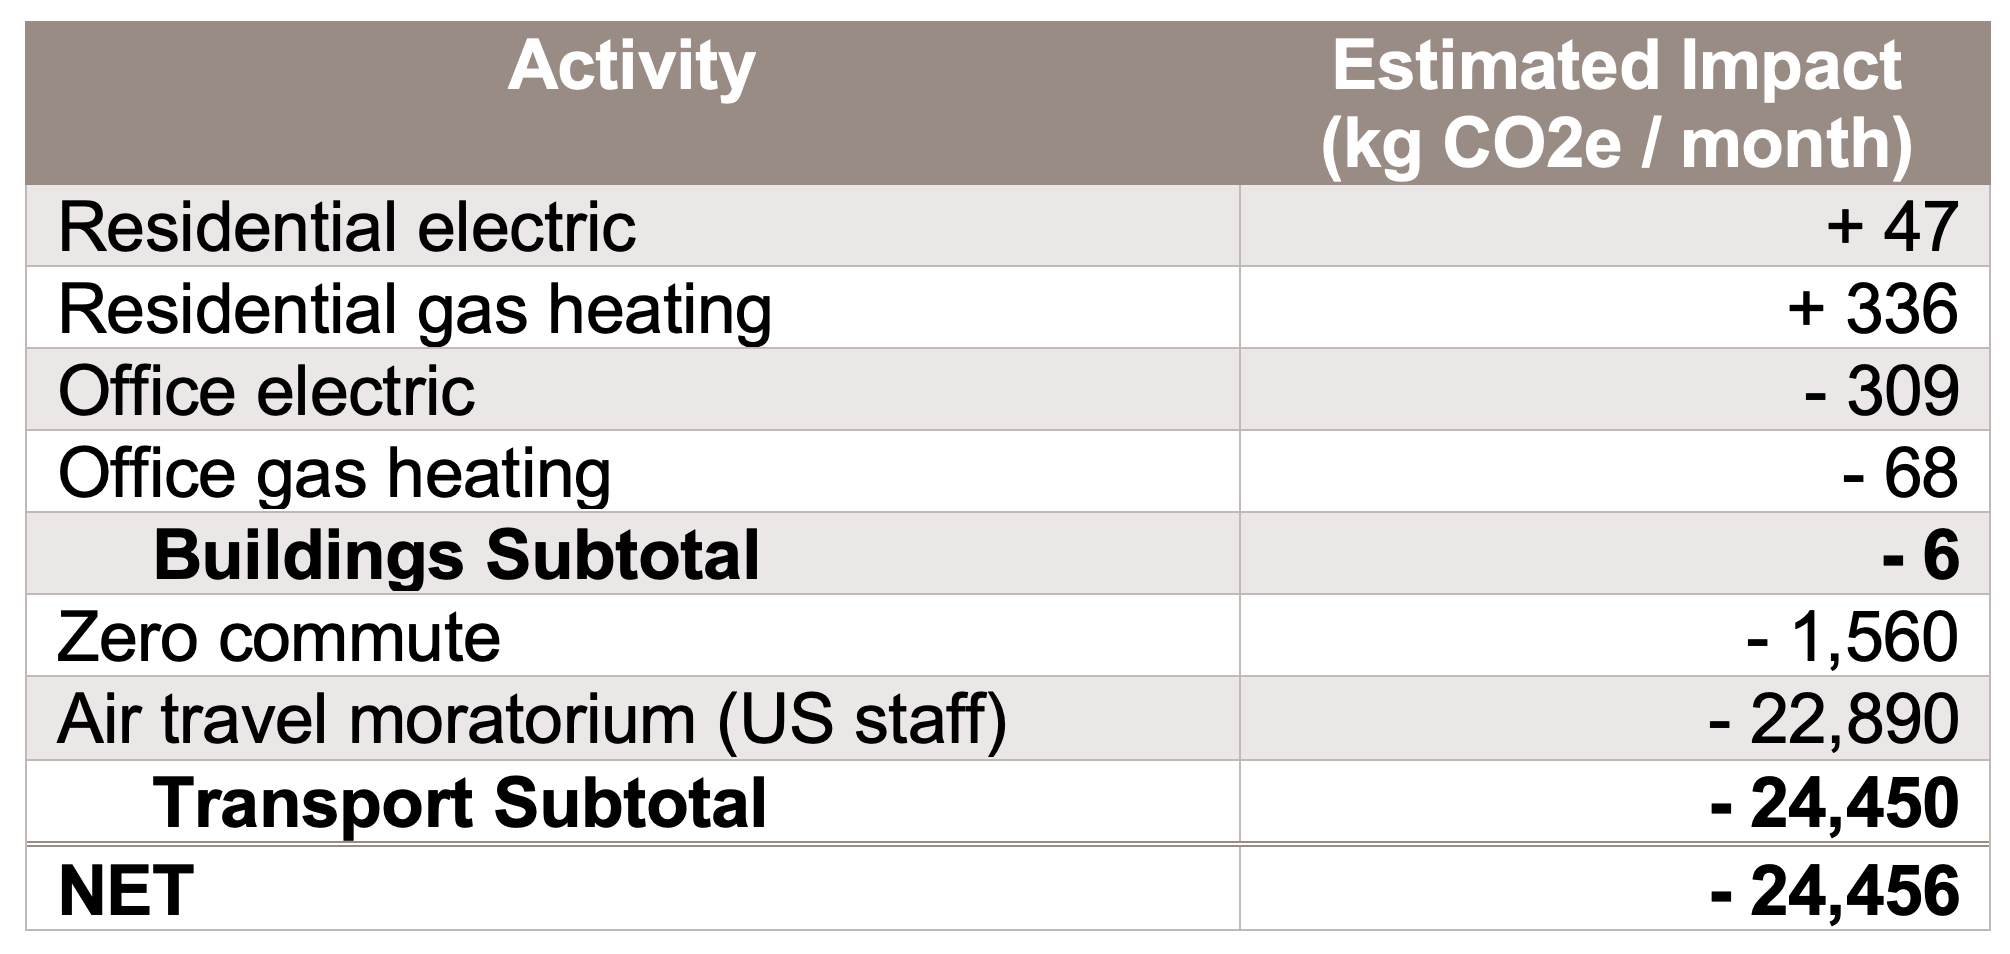
Our informal survey yielded preliminary information that shows minimal (nearly zero) impact from the recent transition to remote work, in terms of building-sector GHG emissions. These are only rough estimates which we can refine over time by collecting time-series energy meter data. It will be interesting, for example, to see how residential energy consumption changes as we head into the summer cooling season in Washington, the hot and humid monsoon of Delhi, and the mild winter of Nairobi (during which at least one colleague makes occasional use of electric resistance heaters). Further data will show if trends are consistent with some of the larger studies conducted by Pecan Street and others.
Our survey also showed that the GHG impacts of travel are orders of magnitude greater than those from our buildings. Air travel in particular contributes 95% of our total GHG emission! It seems likely that COVID-19 will continue to increase our number of virtual meetings, so air travel is likely to remain minimal.
As local economies begin to open back up and people return to the office, it will also be interesting to observe changes in our commuting patterns. It is likely that more people will choose to drive, walk, or bike rather than board a crowded bus or subway train, and the total number of commuting days to the office will also probably decrease.
We will continue to track these impacts over time, and plan to return to this story in the future. In the meantime, we welcome your comments and perspectives on other impacts we should consider and strategies we can use to reduce CLASP’s overall carbon footprint in the future.