02 Current Efforts Fall Short
Failure to limit global warming to below 1.5 °C poses a significant risk of reaching tipping points in the Earth’s climate system that could amplify climate change and lead to far-reaching and potentially irreversible changes on a global scale.1 The current average global surface temperature has surpassed the pre-industrial level by 1.1 °C.2 Achieving NZE and limiting warming to 1.5 °C will require a far greater level of ambition than policymakers, manufacturers, and appliance purchasers and users have shown to date.3
There is also an urgent need to intensify efforts to adapt and build resilience to climate change. As many as 3.6 billion people live in regions that are highly vulnerable to climate change.4 The planet is already feeling the negative social, economic, and public health effects of a warming world. Evidence from the IPCC’s latest assessment report (AR6) shows that climate change has reduced food security, affected water security, and hindered efforts to achieve a just energy transition and meet the UN SDGs.5 Many countries that are at the highest risk to climate-related damages lack access to the energy services and appliances needed to adapt and build resilience to them.
CLASP modeling shows that current efforts to mitigate climate change and expand access to appliances are insufficient.
CLASP modeling shows that appliance emissions reduction efforts are not on track. Even meeting global benchmark policies (the best current or proposed policy for any particular appliance) will not achieve the reductions needed to reach NZE. Under a BAU scenario, appliance emissions would exceed the IEA’s global target needed to achieve NZE in 2050 by 9.0 Gt CO2. The current best global benchmarks would still exceed the target by 7.1 Gt in 2050.
CLASP modeling shows that current efforts to mitigate climate change and expand access to appliances are insufficient.
At the same time, billions of people lack access to even the most basic appliances needed to adapt to a warming world. CLASP’s modeling estimated appliance access, or adoption gaps, for ten essential appliances required to build resilience to climate change. Current appliance access gaps range from 675 million people (lighting and electricity) to over 6 billion people (e-cooking appliances).
This section draws attention to the critical need to increase ambition for appliance efficiency and expand access globally. It is divided into two parts.
In Section 2.1, CLASP describes what is needed to achieve NZE within the appliances sector using IEA’s net zero roadmap. We then model the direct CO2 emissions, electricity, and fuel consumption (EJ) of residential, commercial, and industrial appliances needed to achieve NZE in 2050. Finally, using Mepsy, CLASP models the impact of two scenarios—BAU and a scenario aligned with global appliance benchmarks—for six primarily residential appliances (space heating, water heaters, air conditioners, ceiling, and portable fans, televisions, and refrigerator-freezers), industrial electric motors, and residential and commercial lighting (Table 3). We then compare the estimated emissions from both scenarios in 2050 to IEA’s net zero targets for appliances in the same year. Following these three steps, CLASP assesses whether the appliances sector is on track to meet net zero goals.
In Section 2.2, CLASP estimates global appliance access, or adoption gaps, for the ten appliances essential for building resilience to climate change. These appliances differ from the eight appliances included in Section 1.2 (Table 3). Many of the appliances needed to build climate resilience, like mobile phones, have a negligible impact on global emissions, but are vital to keeping people safe and connected during emergencies. For that reason, we expand the set of appliances studied to include low energy-consuming appliances. CLASP’s analysis focuses on the individual household level and therefore does not include commercial appliances or industrial electric motors.
In both analyses, we find that current efforts are insufficient to reach NZE in 2050 and to meet universal appliance access, or adoption, targets. Greater ambition and commitment to both efficiency and access are needed.
Table 3: Summary of Appliances Included in Section 2
| Section 2.1 models the future climate impact of the following residential, commercial, and industrial appliances: | Section 2.2 evaluates the appliance access/ownership gaps for ten residential appliances: |
|---|---|
|
|
2.1 Existing Policies Exceed Net Zero
There is an urgent need to limit global warming to 1.5 °C [2.7 °F]. The IPCC projects that a shift from 1.5 °C of warming above pre-industrial levels to 2 °C [3.6 °F] would expose an additional 1.7 billion people to severe heat waves, raise the average sea level by an additional 10 centimeters (cm) [4 inches (in)], and expose hundreds of millions more people to climate-related risks and poverty.6 Recent modeling from the World Meteorological Organization (WMO) finds we will surpass the 1.5-degree threshold between now and 2027.7 It is therefore critical to understand what actions are needed to restrict warming to 1.5 °C and assess whether we are on the correct path.
Appliances in IEA’s Roadmap
In 2021, the IEA published a landmark roadmap for reaching NZE by 2050, giving us a 50-50 chance of limiting warming to 1.5 °C. The analysis showed that it is possible to restrict warming to 1.5 °C while simultaneously meeting climate resilience and energy access goals.
However, the window to achieve NZE is narrowing. IEA updated the net zero roadmap in 2022. Results show that a faster-than-anticipated economic recovery from the Coronavirus disease (COVID)-19 pandemic has pushed global fuel-related emissions over 36 Gt CO2 in 2021, the highest single-year increase ever and back to the historic high of 2019.8 This development narrows the window of possibility for achieving net zero and increases the needed speed and ambition of transformative action.
To reach NZE, IEA’s roadmap calls for complete decarbonization of the electric grid, the electrification of fossil-fueled end uses, and greatly improved energy efficiency. IEA expects the electricity sector to decarbonize before industry, buildings, and transportation.9 Their Net Zero Emissions scenario shows that electricity sector emissions must fall from 14 Gt CO2 in 2021, to 7 Gt in 2030, to 0 Gt in 2040. As many appliances are powered by electricity, this decarbonization of the electric system would reduce appliance emissions without any improvements to the appliances themselves. However, CLASP’s analysis finds that decarbonizing the electricity system is not enough to reach NZE in 2050.
Efficient Appliances Keep Net Zero Alive
There is a limit to the amount of electricity that can be provided by carbon-free sources. In IEA’s Net Zero Emissions by 2050 scenario, renewable electricity generation capacity expands fourfold from 2020 to 2030. This equates to a 15% compound annual growth rate—much higher than historical rates—and it is not realistic to expect more. Therefore, electric appliances will need to become more efficient to fit within this “renewable energy budget.”
According to IEA, the energy consumption of the current stock of electric appliances (which we estimate at 70 EJ or 19,444 TWh in 2021) could be accommodated by renewable sources by 2030.10 However, the stock will grow. Additional efficiency improvements will therefore be needed to make room in the renewable electricity budget for:
- Newly electrified appliances and transportation;
- Providing first-time access and resilience; and
- A growing and wealthier population.
Many appliances, and a majority of space and water heating equipment, are powered directly by fossil fuels, not by electricity, and would continue to have negative impacts regardless of electricity system decarbonization. Similar to emissions from electricity generation, IEA anticipates that direct emissions from fuel-burning appliances would need to be reduced to achieve net zero.
Using IEA’s Net Zero Emissions by 2050 scenario, we estimate that appliances in 2050 may use up to 82 EJ of electricity and emit up to 0.1 Gt CO2 directly. The electricity would be provided by renewable and other zero-carbon sources, while the remaining direct emissions would be captured, resulting in NZE. These twin appliance energy and emissions budgets (or allowances) are shown for intermediate years in Table 4.
To develop Table 4, CLASP estimated the indirect emissions from electricity consumption for appliances in both buildings and industry, assuming that motor systems consume 68% of industrial electricity. These indirect emissions from appliances would fall by approximately 50% by 2030 as the electricity system decarbonizes, and then to zero by 2040.11 However, this electricity system transformation is only possible if the total electricity consumption increases by less than 20% (70 to 82 EJ) between 2021 and 2050.
Table 4: Appliance Electricity and Emissions Budgets Necessary to Achieve the IEA’s Net Zero Scenario[footnote]CLASP analysis of IEA, “IEA World Energy Outlook 2022: Tables for Scenario Projections,” tbl. WORLD_TFC_NZE, WORLD_CO2_NZE; IEA, “CO2 Emissions from Fuel Combustion,” tbl. SECTOR, SECTORH; and IEA, “World Energy Outlook 2022,” fig. 3.1.[/footnote]
| SECTOR | IMPACT | 2021 | 2030 | 2040 | 2050 |
|---|---|---|---|---|---|
| Buildings (Residential and Commercial) | Electricity Consumption (EJ) | 45 | 48 | 54 | 57 |
| Indirect Emissions (Gt CO2) | 6 | 3 | 0 | 0 | |
| Direct Emissions (Gt CO2) | 3.0 | 1.6 | 0.5 | 0.1 | |
| Industrial Electric Motor Systems | Electricity Consumption (EJ) | 25 | 25 | 25 | 25 |
| Indirect Emissions (Gt CO2) | 5 | 3 | 0 | 0 | |
| Direct Emissions (Gt CO2) | 0 | 0 | 0 | 0 | |
| Total | Electricity Consumption (EJ) | 70 | 73 | 79 | 82 |
| Direct Emissions (Gt CO2) | 3.0 | 1.6 | 0.5 | 0.1 |
Appliance electrification is necessary to reduce impacts from direct fossil fuel combustion. A transition to heat pumps and other electric alternatives for space heating, water heating, cooking, and lighting will both reduce CO2 emissions and cut down on air pollution. While it is possible to decrease space heating and cooling energy use through building envelope improvements, these are much harder due to the significantly longer lifetimes of buildings compared to appliances.
Second, IEA expects an increase of 2 billion people and a doubling of the world gross domestic product (GDP) by 2050.12 This will lead to additional appliance uptake,13 as will additional appliances and associated electricity consumption from providing access to people who currently lack appliances. However, as previously mentioned, total electricity consumption cannot increase much if there is hope of staying within the renewable electricity budget. We assume any electricity demand in excess of this budget would be supplied predominantly by fossil fuels.
In practice, this means that current electric resistance appliances for space and water heating must be replaced with heat pumps that are two to four times more efficient, which “makes room” in the budget, which then allows methane gas and oil users to also convert to heat pumps. For appliances that are already all-electric (cooling, refrigeration, domestic appliances and electronics, lighting, and industrial electric motor systems), efficiency improvements must accommodate millions of new users and growth in economic activity.14

So, while the amount of electricity consumed does not appear to change significantly from 2021 through 2050, dramatic efficiency improvements are masking substantial growth in the number and usage of appliances. Without ambitious new policies to drive efficiency improvements, direct emissions from appliances will continue while energy use will grow substantially, exceeding the renewable electricity budget and requiring continued use of fossil-fueled electricity.
Even if policies were aligned to CLASP’s Global Benchmark Scenario, efficiency improvements would be insufficient and energy consumption would exceed the renewable electricity budget for residential and industrial motor systems by nearly 100 EJ in 2050, resulting in 7.2 Gt CO2 in 2050.
The authors used Mepsy, CLASP’s Appliances & Equipment Climate Impact Calculator, to model the potential reductions from efficiency and electrification policies for eight appliances responsible for a majority of appliance energy use15 and which have substantial overlap with the ten essential appliances discussed in Section 1.2.16 The eight appliances include:17
- Six primarily residential appliances: space heating, water heaters, air conditioners, ceiling and portable fans, televisions, and refrigerator-freezers;
- Industrial electric motors; and
- Residential and professional (commercial and outdoor) lighting.
The only commercial-sector appliance currently implemented in Mepsy is lighting; therefore, we are primarily comparing our results to IEA’s Net Zero Emissions by 2050 energy budget for the residential sector and 68% of industrial electricity that we estimate powers motor systems.
CLASP assessed the energy and CO2 emissions reduction potential due to policy over the period 2021–2050. Figure 3 and Figure 3 show the modeled energy consumption and emissions, respectively, under a BAU scenario and a scenario modeling today’s global benchmarks. Both scenarios take into account electricity system decarbonization in line with the Net Zero Emissions by 2050 scenario. However, any electricity consumption beyond the “renewable energy budget” is assumed to be supplied by primarily fossil-fueled generation18 and any space and water heating that is not electrified will continue burning fossil fuels. In the BAU scenario, efficiencies are maintained at today’s typical levels, while in the Global Benchmarks scenario, they are increased to some of the world’s most stringent policies recommended by CLASP and other efficiency organizations, starting in 2025.19 For air conditioners, refrigerators, and industrial motors, they are based on U4E’s model regulations.20 Some of these global benchmarks remain aspirational and have yet to be adopted in full by any government.
In Figures 3 and 4 below, CLASP compares budgets based on IEA’s Net Zero by 2050 scenario for appliances to the two policy scenarios for both energy use (electricity and fuel consumption) and CO2 emissions. The graph in Figure 3 shows that BAU and even some of the most ambitious policies in play today for residential and industrial appliances greatly exceed the energy budgets. Despite some improvement over BAU, the efficiency gains from aligning policies to global benchmarks will be nullified by growth in the number and use of appliances.
They fail to take advantage of energy reductions achieved by heat pumps replacing electric resistance and fossil fuels for space and water heating.
Figure 3: Electricity & Fuel Consumption Under BAU & Global Benchmarks Scenarios

As a result of energy use (fuel and electricity) exceeding the budget and not fully electrifying, the emissions do not fall to 0.1 Gt by 2050 as required in the emissions budget in Figure 4, and even grow between 2040 and 2050, in line with growing energy use.
Figure 4: CO2 Emissions Under BAU & Global Benchmarks Scenarios

In sum, the BAU and Global Benchmarks scenarios are off track to reach NZE in 2050 by 9.0 Gt and 7.1 Gt, respectively.

2.2 Large Access Gaps Persist
Adapting to a warming world will require appliances. However, many households and businesses do not have access to the appliances they need because they cannot afford them, modern appliances are not available in their area, or they do not have access to modern energy. At the same time, there is an urgent need to improve the efficiency of existing appliances and promote rapid decarbonization and reduced dependence on fossil fuels within the built environment by adopting electric heating and cooking solutions.
To understand the magnitude of current appliance access and ownership gaps, we used publicly available data sources to quantify the penetration of appliances in countries and estimated the number of people lacking access to each essential appliance type.21 For lighting, air conditioners, fans, refrigerators, mobile phones, televisions, and radios, we focus on the need and benefits of first access. For heat pumps and e-cooking, we focus on the need and benefit of a shift to electric alternatives. For solar water pumps, we cover both smallholder farmers benefiting from mechanized (rather than manual) irrigation for the first time or switching away from polluting diesel. Despite the different circumstances of people accessing appliances for the first time or switching to efficient alternatives, the two scenarios share benefits: lower fuel costs, lower pollution, and lower GHG emissions.
CLASP’s analysis finds large access or ownership gaps exist for all ten appliances. Table 5 shows the percentage of the population without access to each appliance.22 For four of the ten appliances assessed, we estimated access rates for 162 countries, which make up the vast majority of the global population. In some cases, estimating global appliance access for all countries was not appropriate or not possible due to a lack of data (see heat pumps, televisions, lighting, and solar water pumps). In these cases, we assessed access as a percentage of the subset of the global population for which data were available. For example, we were only able to estimate heat pump access for 25 countries, instead of 162; therefore, the data presented for heat pumps reflect access in those specific countries, rather than access globally.
Table 5: Share of Population with Access/Ownership (Latest Year Available)[footnote]To estimate the number of people or households that lack access to a specific appliance, we multiply the total households/population in a given country by the proportion without access. This represents the appliance access gap in that country. We supplement any missing data (for countries, recent years, or both) through regression and other modeling, resulting in a worldwide view of access gaps for essential appliances.[/footnote]
| Appliance | Base population*(billions) | Population that owns appliance (billions) | Population that does not own appliance (billions) | Percentage of the population that owns appliance | Percentage of the population that does not own appliance |
|---|---|---|---|---|---|
| Lighting | 7.7 | 7.0 | 0.7 | 91% | 9% |
| Air Conditioners and Fans | 2.4 | 1.2 | 1.2 | 50% | 50% |
| Refrigerators-Freezers | 7.7 | 6.0 | 1.7 | 78% | 22% |
| Heat Pumps | 2.4 | 0.8 | 1.6 | 34% | 66% |
| E-Cooking | 7.3 | 1.1 | 6.2 | 15% | 85% |
| Solar Water Pumps | 2.1 | 0.0 | 2.1 | 1% | 99% |
| Mobile Phones | 7.7 | 5.8 | 1.9 | 76% | 24% |
| Televisions | 7.7 | 6.7 | 1.0 | 87% | 13% |
| Radios | 3.2 | 0.9 | 2.3 | 28% | 72% |
Appliance access, or ownership gaps, at the country level for the ten appliances listed in Table 3 above are shown in Figures 5-13. Each country is shaded according to the size of the access gap:
- Countries with small access gaps are shaded in dark blue.
- Countries with large access gaps are shaded in red.
- Countries shaded in gray are those for which data are not available.
The data and methodology used to estimate appliance access gaps are detailed in Annex A: Appliance Access Gap Methodology.
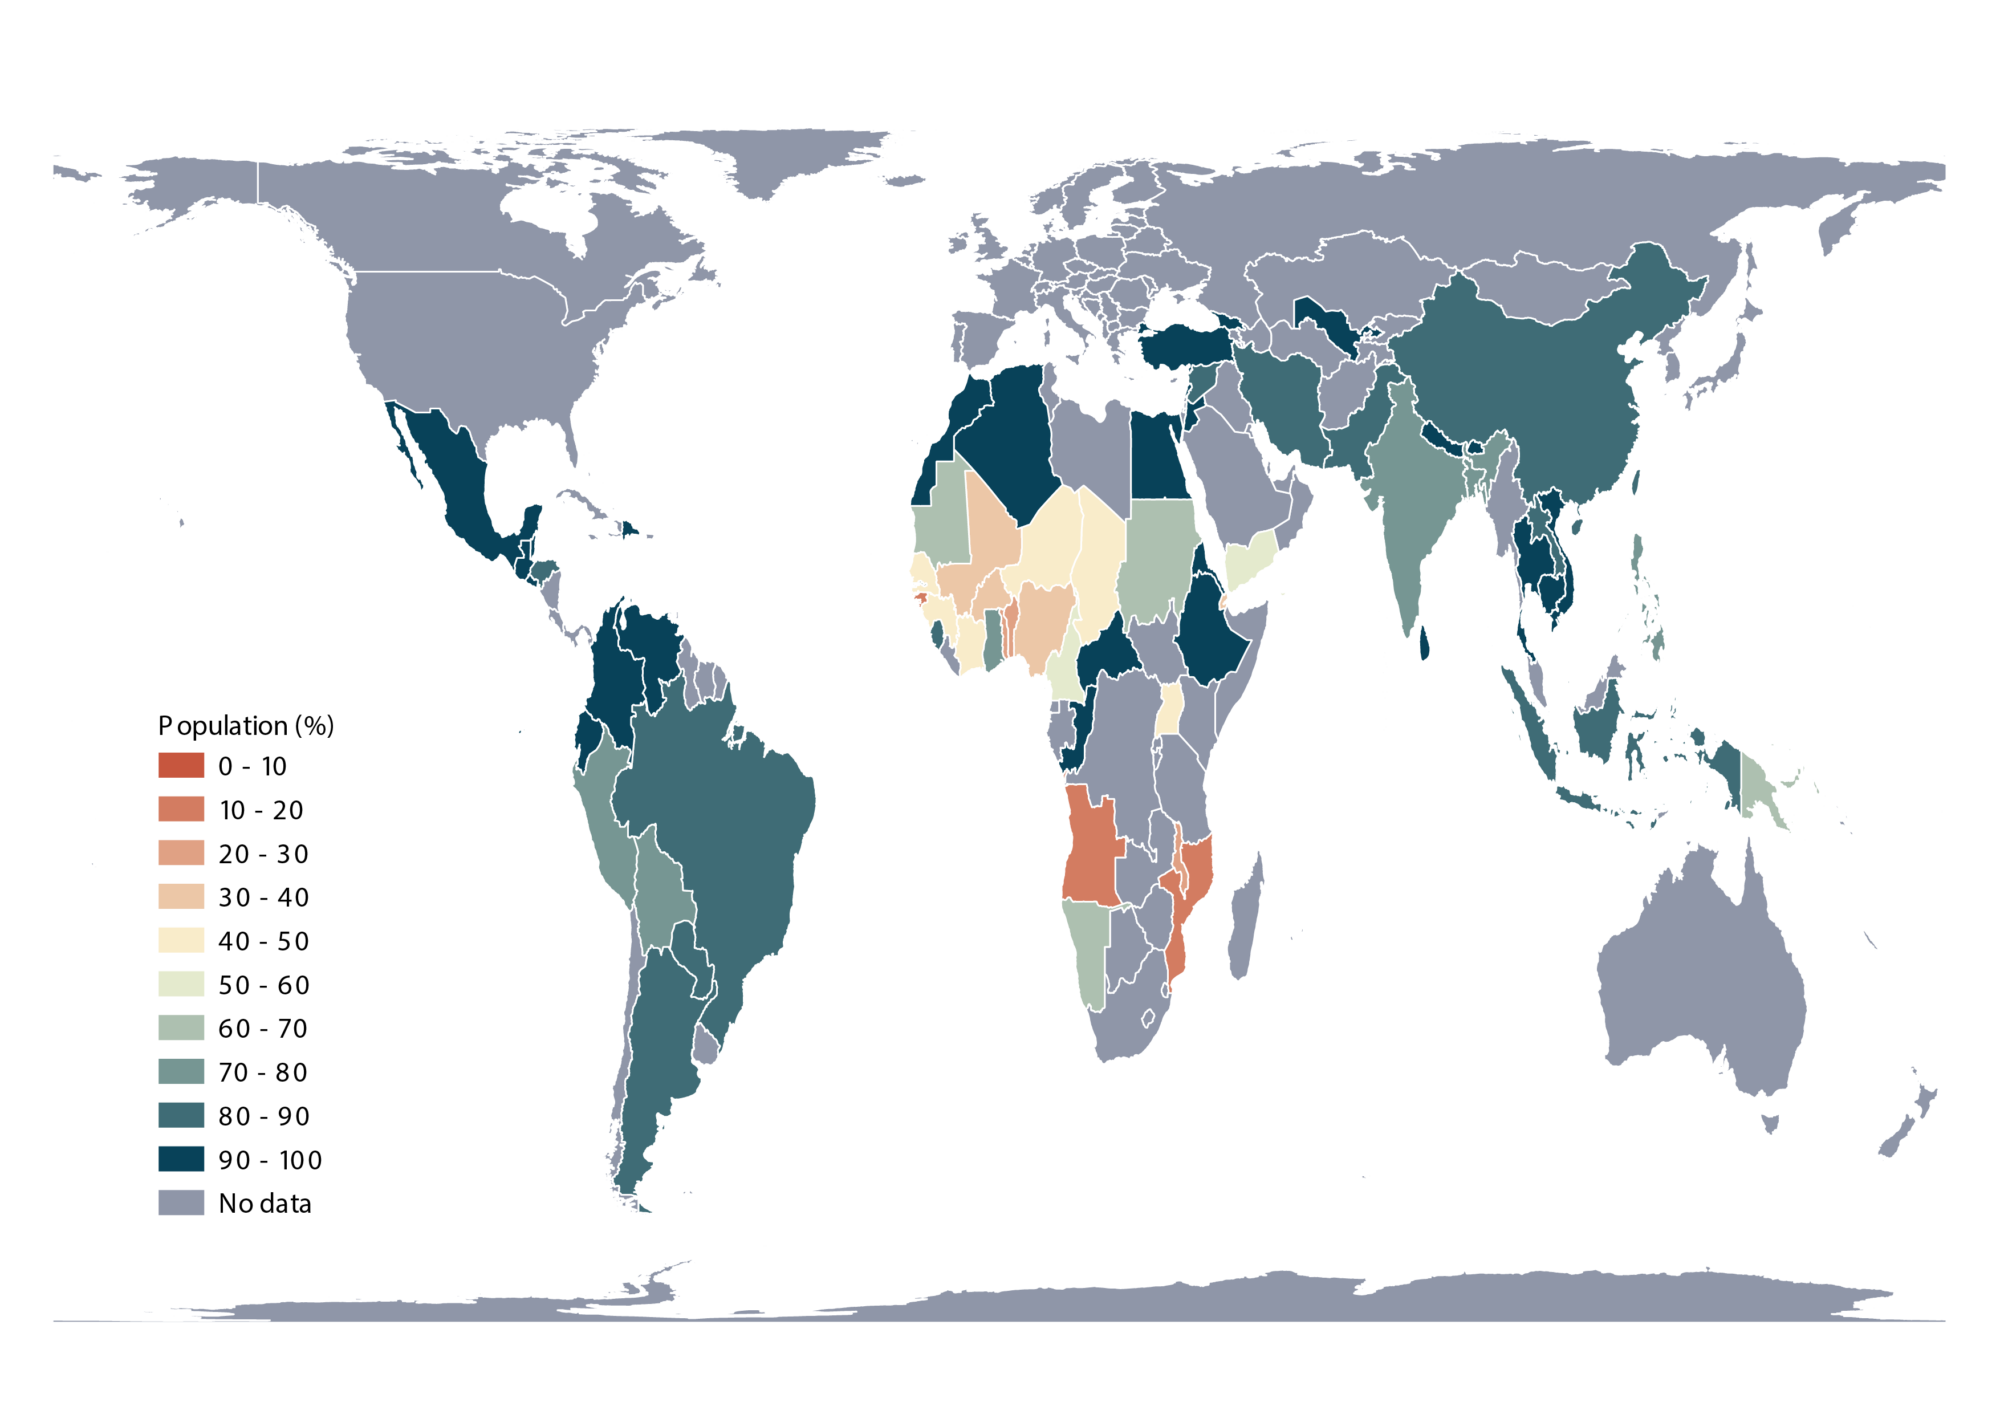
Lighting
Universal access to modern energy services is one of three priorities under SDG 7. This goal has prioritized energy services that meet Tier One electricity access according to the World Bank’s Energy Sector Management Assistance Program (ESMAP) and Sustainable Energy for All’s (SEforALL) Multi-Tier Framework, which is sufficient to power basic task lighting.23 While progress has been made to close energy access gaps, particularly in India, the number of people without access to energy services actually increased in 2022.24 In this analysis, we use access to electricity as a proxy for access to lighting, ignoring lanterns and kerosene lamps, which are not considered modern appliances.25
Based on these assumptions, we estimate that 8% of the global population (675 million people) lacked access to lighting in 2021.26 The largest access gaps for lighting occur in sub-Saharan Africa.27 Of the 675 million people without access to electricity, nearly 83% (566 million people) reside in sub-Saharan Africa.28 Unfortunately, steady progress in electrification has been offset by population growth. As a result, the number of people without access has remained stagnant.29 Within sub-Saharan Africa, South Sudan, Burundi, and Chad have the largest access gaps, with 92%, 90%, and 89% of the population lacking access to electricity and task lighting, respectively (Figure 5).
Within many countries, there is a sharp divide in electricity access between urban and rural communities. According to the latest Energy Progress Report, electrification has occurred at a faster pace in rural areas than in urban areas since 2010.30 Unfortunately, access gaps in rural environments remain large because access rates in rural areas started from very low levels. Closing lighting access gaps in rural communities will require a better understanding of electricity uses and greater mobilization of financing to make access to electricity and lighting more affordable and infrastructure more resilient.31
Figure 5: Residential Electricity & Lighting Access (2021)

Air Conditioners & Fans
Air conditioners and fans supply critical cooling services that provide thermal comfort by lowering the ambient temperature of a space and increasing airflow. A more comfortable environment decreases the risks of heat-related health complications and can improve productivity.32,33 Fans are already ubiquitous in hot and humid countries, including India34 and Indonesia,35 but as incomes and global temperatures rise, they may be replaced with air conditioners. The IEA estimates that by 2050, as much as two-thirds of the world’s population could own an air conditioner; if efficiency is not prioritized, energy demand for space cooling will more than triple.36
SEforAll estimates that 1.2 billion people are at high risk of lacking access to air conditioners and fans (Figure 6), based on the 76 countries assessed in their 2022 report Chilling Prospects: Tracking Sustainable Cooling for All. An additional 2.4 billion lower-middle income people are at medium risk of lacking access to cooling appliances. Most of the 1.2 billion people at high risk are the urban and rural poor. These communities often do not have access to electricity, live below the poverty line, and/or live in buildings with poor ventilation and construction. The largest access gaps occur in Southern Asia (422 million), sub-Saharan Africa (375 million), and Eastern Asia (158 million).
Figure 6: Figure 6: Residential AC & Fan Access (2022)85
Refrigerators
Modern refrigeration has changed the way households secure, prepare, and store food, liberating women and children from household drudgery by reducing the time needed to shop for groceries and prepare food. Evidence from the US shows that the diffusion of refrigerators, washers, and other durable household appliances contributed to a 70% decline in the time spent on housework between 1900 and 1975, and helped propel women into the workforce.37 Access to a refrigerator frees up additional time for those responsible for meal preparation, unlocking new opportunities for productive or leisure activities.
Refrigerators are also used by small businesses to generate more income through the sale of cold drinks and perishable items. A survey of solar off-grid refrigerator customers in Kenya, Tanzania, and Uganda found that 45% of customers were interested in using their fridge to generate more income, including 18% of customers who purchased their refrigerator to sell cold drinks.38 Beyond household and productive use, refrigerators provide vital cooling services from vaccine storage to post-harvest loss reduction for perishable agricultural goods. This report assesses refrigerator access for products suitable for domestic and light commercial use only.
CLASP estimates that 75% of the global population has access to a refrigerator. There is a large divide in refrigerator access between sub-Saharan Africa and the rest of the world (Figure 7). An estimated 60% of the population in sub-Saharan Africa does not have access to a refrigerator (822 million people). Within the sub-region, Mauritius, Gabon, Botswana, Equatorial Guinea, and South Africa have the highest rates of refrigerator ownership, with 85% or more of the population in each country having access.
As with other appliances, the total number of people without access to a refrigerator in Asia is similar to sub-Saharan Africa despite the latter having lower access rates, due to Asia’s much larger population. We estimate that 770 million people in Asia do not have access to a refrigerator, with the largest gaps occurring in South Asia (25% without access, 494 million people) and Southeast Asia (14% without access, 85 million people).
In Oceania, 7 of the 8 million people without access to a refrigerator reside in one sub-region, Melanesia. An estimated 68% of the population in this sub-region, which includes Papua New Guinea, lack access to a refrigerator.
Figure 7: Residential Refrigerator Access (2022)

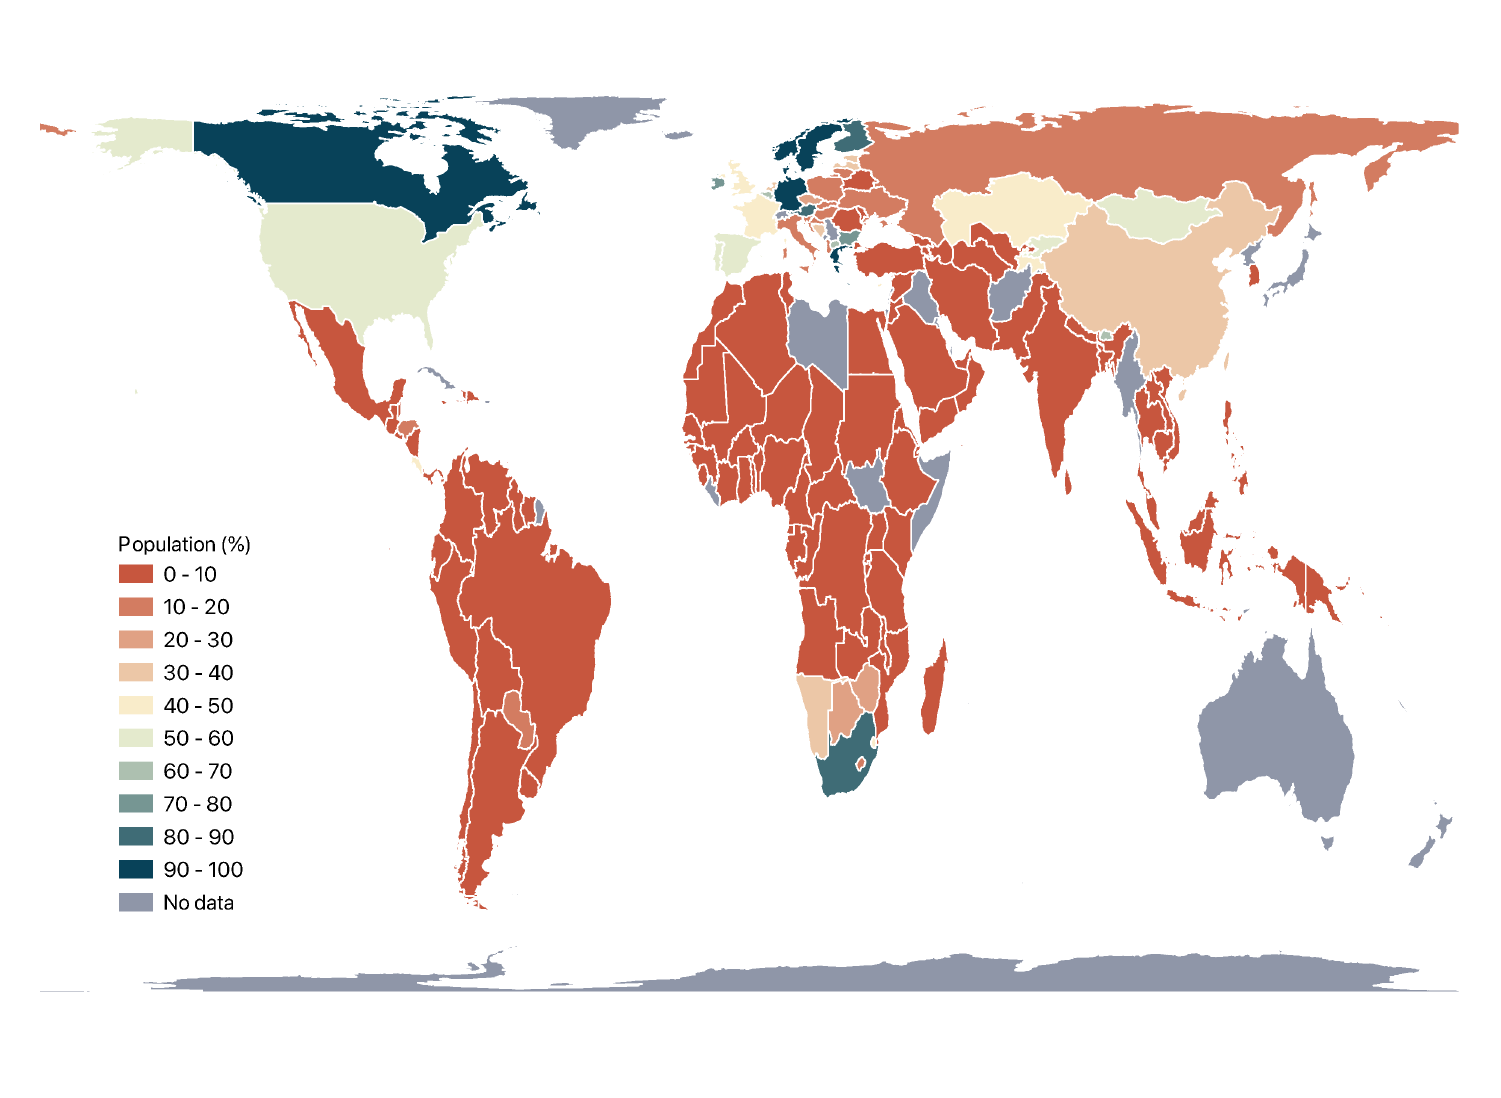
Heat Pumps
Heat pumps are a super-efficient way to provide heating and cooling services. Heat pumps used to heat and cool spaces take ambient energy from the air, such that they can move three to five units of heat for every unit of electricity they consume.39 They are a critical component to building decarbonization, electrification, and NZE goals. The IEA’s latest Net Zero Roadmap states that, by 2045, half of global heating demand must be met by heat pumps. Fuel switching via efficient heat pump adoption will be critical in the Global North and key markets like China, where there is a demand for both heating and cooling services and a need to rapidly decarbonize building-related emissions.
Heat pumps are not a new technology and have been available in many countries for decades. However, uptake of the technology across parts of East Asia, Europe, and North America remains low. Among the 25 countries for which we have data, we estimate that 33% of people use a heat pump to heat their home (Figure 8). This estimate is heavily skewed by Japan, Norway, Sweden, and China where 90%, 60%, 43%, and 42% of the population own the technology, respectively. Many of these countries have made a concerted effort to deploy energy-efficient heat pumps.
![]() Case Study: In 1991, Japan sought to reduce its dependence on fossil fuels by increasing electricity generation and improving the energy efficiency of appliances.40 Over 15 years, 15 million residential heat pumps were deployed for space heating and cooling, and 35,000 heat pump water heaters were deployed over ten years.41 Today, Japan is one of the largest markets for heat pumps and the second largest market for heat pump water heaters, with shipments of the latter reaching 500,000 units in 2020.42
Case Study: In 1991, Japan sought to reduce its dependence on fossil fuels by increasing electricity generation and improving the energy efficiency of appliances.40 Over 15 years, 15 million residential heat pumps were deployed for space heating and cooling, and 35,000 heat pump water heaters were deployed over ten years.41 Today, Japan is one of the largest markets for heat pumps and the second largest market for heat pump water heaters, with shipments of the latter reaching 500,000 units in 2020.42
Adoption of efficient heat pumps remains low across North America and most of Europe, though the rate of adoption is accelerating. We estimate that in 2022, 14% of the population in North America, and 7% of the population in Europe used heat pumps. In an effort to decarbonize their economies and reduce dependence on fossil fuels, both regions have put forth efforts to deploy heat pumps at scale. In the US, the Inflation Reduction Act provides rebates of up to USD$8,000 USD to households to purchase and install a heat pump.43 In the European Union (EU), the energy crisis sparked by the Russian invasion of Ukraine is pushing multiple countries to meet electrification targets earlier than originally planned. Expanding policies and incentives to increase market penetration of heat pumps will be essential to accelerating heat pump ownership to meet global adoption targets by 2045.
Figure 8: Residential Heat Pump Adoption (Latest Year Available)

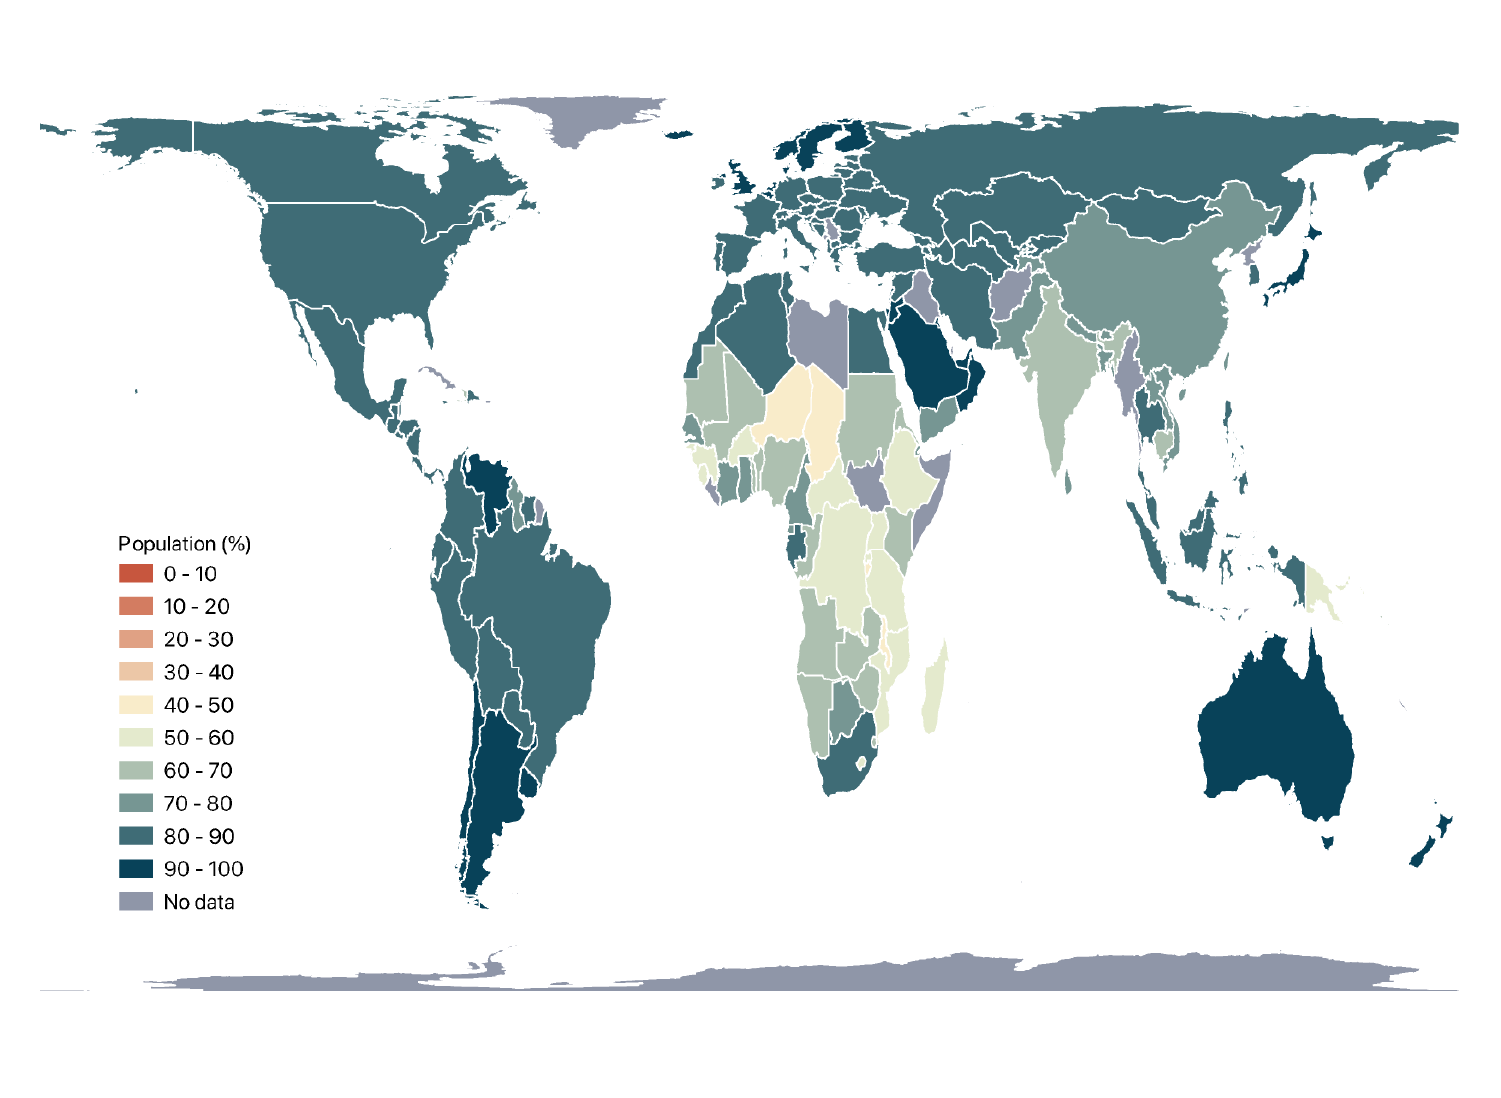
Electric Cooking
Adopting modern cooking fuels in regions with low clean cooking access and transitioning from fossil fuel to electric cooking in regions with high rates of clean cooking access offer several climate, resilience, and sustainable development benefits. In this section, we assess the proportion of households that have adopted electricity as their primary cooking fuel.
In regions where wood fuels are the dominant cooking fuel, access to clean cooking fuels can help curb deforestation and black carbon emissions, both of which contribute to climate change.44 Emissions from nonrenewable wood fuels for cooking make up nearly 2% of global emissions (1 Gt CO2e per year).45 A lack of clean cooking contributes to 3.7 million premature deaths annually, with women and children most at risk.46 A transition to clean cooking would help advance a number of SDGs, with substantial benefits to public health. Additional benefits would come in the form of reduced drudgery from fuel collection for women and children, potentially freeing up time for education and income-generating activities.47
In regions where the majority of households already have access to clean cooking fuels, a transition to electric appliances would deliver additional health benefits and help drive electrification and decarbonization efforts. Evidence from the US suggests that gas cooking appliances contribute to poor indoor and outdoor air quality (see Section 1).48
CLASP advocates for a worldwide transition to e-cooking solutions. While clean cooking technologies like improved biomass stoves and fossil fuel cooking appliances substantially reduce exposure to household air pollution, they still produce emissions that contribute to poor air quality.49,50 Electric cooking appliances, in contrast, do not directly emit harmful air pollutants like nitrogen oxides (NOx), carbon monoxide (CO), or fine particulate matter.
The social and economic barriers to widespread e-cooking adoption are not to be understated. User preferences and cultural cooking practices have a strong influence on households’ preferred cooking appliances and fuels. Cooking methods vary across regions and require different appliance-fuel combinations (fuel stacking).51,52,53 We recognize that a complete transition to e-cooking may not be possible. For example, a person may use a rice cooker, microwave oven, and an outdoor barbecue when preparing a single meal. However, setting a clear target for widespread adoption of e-cooking appliances and electricity as the primary cooking fuel can help align efforts to electrify buildings and ensure the health benefits of a clean energy transition are maximized.
CLASP estimates that only 16% of the global population use e-cooking appliances as their primary appliance for cooking. Use is highest in Western Europe and North America, where 72% and 60% of the population primarily cook with electricity, respectively (Figure 9). Within these sub-regions, use of e-cooking appliances is highest in Norway (100%), Sweden (98%), Denmark (97%), Germany (97%), Greece (93%), and Canada (91%).54
Use of e-cooking remains low across Latin America and the Caribbean, Africa, and much of Asia, often driven by a lack of access to electricity and clean cooking appliances. In Latin America and the Caribbean, 98% of the population (63 million people) does not have access to e-cooking. Within Africa, 236 million people across North Africa (98% of the population) and 989 million people in sub-Saharan Africa (93% of the population) lack access to e-cooking. Asia has the largest share of the global population without access to e-cooking. An estimated 1.9 billion people in Southern Asia (99% of the population), 598 million people in Southeast Asia (99% of the population), and 987 million people in East Asia (66% of the population) lack access to e-cooking. In these sub-regions, most households without modern cooking access rely on biomass (e.g., wood and animal dung), while some households rely on kerosene.55,56
Figure 9: Residential E-Cooking Adoption (Latest Year Available)
Solar Water Pumps
Approximately 95% of farmland in Sub-Saharan Africa and 60% in South Asia is rainfed—relying on unpredictable weather patterns. Solar water pumps—a clean, modern irrigation solution—have the potential to increase yields by two- to threefold, depending on crop and climate.57
We assessed solar water pump access in 13 countries:58 Côte D’Ivoire, Ethiopia, India, Kenya, Malawi, Mozambique, Nigeria, Rwanda, Sierra Leone, Uganda, Tanzania, Zambia, and Zimbabwe. For each country, we estimated the number of non-subsistence smallholder farmers that lack a reliable connection to the main power grid and assumed that all could benefit from access to solar water pumps.59 We focus on solar versus grid-connected electric pumps because solar pumps are:
- More reliable in areas with inconsistent access to the grid;60
- Less expensive to run, with zero operation and low maintenance cost, making for an effective investment;61
- Easier to install without the help of a technician;62 and
- Are lower-carbon (unless the local electricity grid is powered by renewable sources).
We found that less than 1% of smallholder farmers in 12 of the 13 countries assessed had access to a solar water pump (Figure 10). The largest access gaps are in India (23 million people), Ethiopia (8 million people), Nigeria (5 million people), Uganda (2 million people), and Kenya (2 million people).
Most efforts to expand access to pumped irrigation include incentives for fossil fuel-, electric-, and solar-powered pumps. For example, India has used subsidies to rapidly deploy mechanized water pumping solutions to benefit farmers and the agricultural sector, including solar water pumps. However, solar water pumps make up only a small fraction of the total installed pumps in India. It is estimated that of the 30 million irrigation systems installed, 70% are electric, 29% are diesel, and 1% are solar.63 In 2019, the Indian government launched the Pradhan Mantri Kisan Urja Suraksha evam Utthaan Mahabhiyan (PM-KUSUM) scheme, which provides a 60% subsidy for solar water pumps and aims to install 2.75 million pumps by 2022.64As of July 2023, over 900,000 irrigation pumps had been installed, 120,000 of them solar water pumps.65
Solar water pumps are commercially available but have not yet reached scale. Government and donor intervention is required to help the market reach maturity. Programs are needed that target new business models, access to finance, affordability, and low customer awareness of solar water pump technology.
Figure 10: Solar Water Pump Access (Latest Year Available)

Mobile Phones
Mobile phones are critical enablers of sustainable development, allowing people to access vital information and essential services like financial access and healthcare. Bridging mobile phone access gaps helps close the digital divide66 and enables access to banking and formal credit systems, thereby expanding access to energy and other appliances. Services such as pay-as-you-go financing, which allow customers to pay for solar energy and appliances in installments, have helped make access to modern energy services more affordable and accessible for households with no or limited access to the grid.
Mobile phone ownership is the highest among the ten appliances included in our analysis. An estimated 76% of the population (5.8 billion people) own a mobile phone. The relatively low cost of mobile phones coupled with the rapid expansion of mobile and data networks have enabled millions of people in emerging economies to bypass fixed-line telephones altogether through technology leapfrogging.
Despite the rapid diffusion of mobile phones, a digital divide remains, particularly in Africa and Asia (Figure 11). In Africa, 35% of the population (475 million people) do not own a mobile phone. Within Africa, the majority of people without a mobile phone reside in Sub-Saharan Africa, 424 million people. In Asia, 26% of the population do not own a mobile phone. However, because of Asia’s large population, the total number of people without access to a phone in Asia, 1.2 billion people, represents 63% of the global population without mobile phone access.
Figure 11: Individual Mobile Phone Access (2022)
Televisions
Televisions are among the most popular household appliances that promote stronger family relationships, educate and create awareness on current issues, and can potentially reduce stress levels when used for entertainment.67 When a household gains access to electricity, televisions are often one of the first appliances they purchase. In areas disconnected from the electric grid, energy-efficient televisions can help drive energy access by catalyzing market growth and reducing the total cost of solar home systems by allowing use of photovoltaics and batteries with less capacity than would be required for standard TVs.68
Compared to mobile phones, there is a stark divide in television ownership between sub-Saharan Africa and the rest of the world (Figure 12). Globally, 87% of the population has access to a television. However, in sub-Saharan Africa, that figure drops to just 47%. We estimate that 594 million people in Africa do not have access to a television. Within the sub-region of sub-Saharan Africa,69 the largest access gaps persist in Central and Southern Africa.
Within Asia, the Southern, Central, and South-Eastern sub-regions have the largest access gaps with 11%, 8%, and 6% lacking access, respectively. The total number of people without access to a television in these sub-regions is considerable, totaling 264 million people or 44% of the global population without access.
Figure 12: Residential Television Access (2022)

Radios
While radios do not make up a significant share of global energy demand, they are important appliances for distributing information to the public. Despite the proliferation of televisions, cell phones, and social media apps, many adults around the world still turn to radio broadcasts for news, information, and entertainment. In 2021, 80% of South Africans aged 18 or older reported listening to the radio within the last week.70 Similar trends have been reported in the US, where 82% of the population aged 12 or older reported listening to the radio on a weekly basis.71
Limited data on radio access exists. Of the 52 countries for which we were able to estimate access rates, 28% of households had access to a radio (Figure 13). Vietnam, Kyrgyzstan, Mongolia, India, and Bangladesh had the largest access gaps with 99%, 98%, 98%, 95%, and 87% of the population lacking access to a radio, respectively.72 India, Bangladesh, Nigeria, Brazil, and Vietnam have the largest access gaps by population; these five countries make up nearly 20% of the population without access to a radio. However, low access rates may indicate the technology has been superseded by other media. With the expansion of mobile phones, televisions, and the internet, people may turn to broadcast and digital media for news, information, and entertainment.
Figure 13: Residential Radio Access (Latest Year Available)

Facing Climate Hazards
There is an urgent need to close appliance access gaps. The planet is already experiencing the negative effects of climate change. 2023 is on track to be one of the warmest years on record. The effects of global warming are everywhere, from the massive wildfires in North America,73 to catastrophic drought in East Africa,74 deadly floods in Asia,75 and record-breaking heat waves across the Northern Hemisphere.76 The frequency of climate hazards and number of people affected is expected to increase as the planet warms.
The problem of access is particularly acute where people are most exposed to climate hazards. We selected two important climate hazards—exposure to extreme heat and agricultural drought risk—and overlaid those hazards with cooling and solar water pump access data at the national level.
There is a high degree of overlap between appliance access gaps and exposure to climate hazards. Many of the countries with the largest appliance access gaps are also those most at risk to the dangers of climate change.
In other words, appliances are lacking from exactly those communities that most need them and the adaptation/resilience benefits they deliver.
Air Conditioners & Fans
The World Health Organization (WHO) estimates that 12,000 people lose their lives annually due to extreme heat waves and projects that figure could rise to 255,000 annually by 2050 without adaptation measures.77
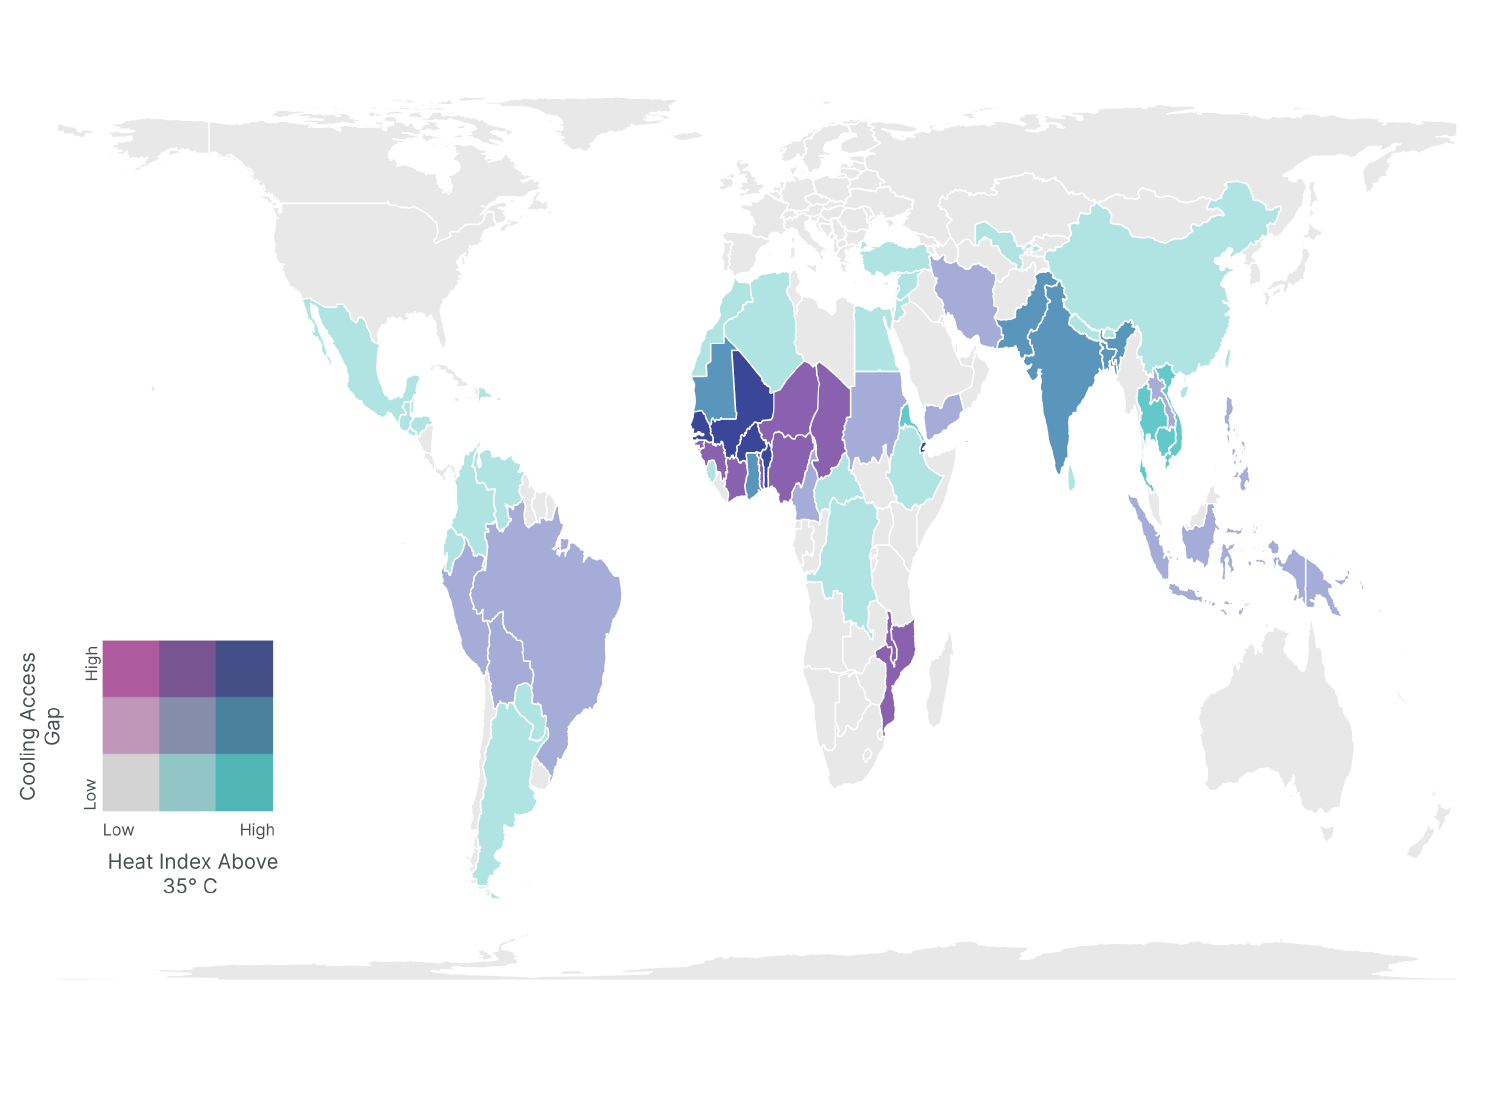
Figure 14 compares the percentage of the population without access to an air conditioner or fan78 to the number of days the daily mean Heat Index79 rose above 35 °C [95 °F] in 2020. In the map, magenta (pink) shading is used to show the population proportion that lacks access to cooling, while cyan (blue) shading is used to show the prevalence of extreme heat. Darker shading indicates countries with larger access gaps, more extreme heat, or both. We find that populations in West Africa, South Asia, and Southeast Asia are most at risk because they are exposed to a high number of days of extreme heat and have limited access to cooling appliances.
Figure 14: Cooling Access & Heat Risk (2022)
Solar Water Pumps
Climate change will increase the intensity of drought, posing a number of risks to global food security.80,81 Figure 15 overlays projected hazards due to heat and drought on top of solar water pump access gaps. It shows that the farmers in six of the 13 countries studied have large solar water pump access gaps and have medium or high vulnerability to agricultural drought, highlighting the crucial role solar water pumps can play in building climate resilience82 in these economies.83,84
Figure 15: Solar Water Pump Access & Agricultural Drought Risk (2018-2022)86

Jump to the next section, Net Zero Heroes: Efficient Appliances.
For a full list of references and endnotes, please download the report PDF.
0. Hoegh-Guldberg, O., D. Jacob, M. Taylor, M. Bindi, S. Brown, I. Camilloni, A. Diedhiou, R. Djalante, K.L. Ebi, F. Engelbrecht, J.Guiot, Y. Hijioka, S. Mehrotra, A. Payne, S.I. Seneviratne, A. Thomas, R. Warren, and G. Zhou, “Impacts of 1.5°C of Global Warming on Natural and Human Systems,” in Global Warming of 1.5°C. An IPCC Special Report on the Impacts of Global Warming of 1.5°C above Pre-Industrial Levels and Related Global Greenhouse Gas Emission Pathways, in the Context of Strengthening the Global Response to the Threat of Climate Change, Sustainable Development, and Efforts to Eradicate Poverty (Cambridge, UK and New York, NY, USA: Cambridge University Press, 2018), 175–312, https://www.ipcc.ch/site/assets/uploads/sites/2/2022/06/SR15_Chapter_3_HR.pdf.
1. IPCC, “AR6 Synthesis Report,” 4.
2. IEA, “Net Zero by 2050: A Roadmap for the Global Energy Sector,” 15.
3. IPCC, “AR6 Synthesis Report.”
4. IPCC.
5. IPCC.
6. WMO, “WMO Global Annual to Decadal Climate Update (Target Years: 2023-2027)” (Geneva: World Meteorological Organization, 2023), https://library.wmo.int/index.php?lvl=notice_display&id=22272.
7. IEA, “World Energy Outlook 2022.”
8. IEA, “Net Zero by 2050: A Roadmap for the Global Energy Sector.”
9. IEA projects renewable generation to grow to 23,064 TWh in 2030 in its Net Zero Emissions by 2050 scenario. IEA, “IEA World Energy Outlook 2022: Tables for Scenario Projections,” tbl. WORLD_Elec_NZE.
10. IEA, “World Energy Outlook 2022,” Fig. 3.1.
11. IEA, “Net Zero by 2050: A Roadmap for the Global Energy Sector,” 47.
12. IEA, “Global Average Household Ownership of Appliances in the Net Zero Scenario, 2000-2030,” IEA, June 19, 2023, https://www.iea.org/energy-system/buildings/appliances-and-equipment.
13. IEA, “World Energy Outlook 2022,” fig. 3.16.
14. Our review of residential and commercial end-use consumption surveys and modeled electricity use from industry in China, European Union, India, and the United States found that these eight are responsible for 75% energy use.
15. Cooking appliances, radios, cell phones, and solar water pumps are not included in Mepsy and were not modeled.
16. CLASP, “Mepsy Methodology & Assumptions,” 2022, https://www.clasp.ngo/wp-content/uploads/2021/04/mepsy-model-assumption.pdf.
17. Follows default Mepsy grid emission factors, which are based on International Financial Institutions, “The IFI Dataset of Default Grid Factors,” April 2022, https://unfccc.int/climate-action/sectoral-engagement/ifis-harmonization-of-standards-for-ghg-accounting/ifi-twg-list-of-methodologies in the short term, then decrease by 30% through 2050.
18. For example, United4Efficiency model regulations for ACs, refrigerators, and motors. United for Efficiency, “Model Regulation Guidelines,” United for Efficiency, accessed May 12, 2023, https://united4efficiency.org/resources/model-regulation-guidelines/; See MEPS levels here: CLASP, “Mepsy Methodology & Assumptions”, except for space heating, where we assumed BAT (40% electrification of fossil fuels with heat pumps).
19. United for Efficiency, “Model Regulation Guidelines.”
20. The data and methodology used to estimate appliance access gaps are detailed in a separate document, Annex A: Appliance Access Gap Methodology.
21. To estimate the number of people or households that lack access to a specific appliance, we multiply the total households/population in a given country by the proportion without access. This represents the appliance access gap in that country. We supplement any missing data (for countries, recent years, or both) through regression and other modeling, resulting in a worldwide view of access gaps for essential appliances.
22. ESMAP, “Electricity,” Multi Tier Framework, 2022, https://mtfenergyaccess.esmap.org/methodology/electricity.
23. Laura Cozzi et al., “For the First Time in Decades, the Number of People without Access to Electricity Is Set to Increase in 2022,” IEA, November 2022, https://www.iea.org/commentaries/for-the-first-time-in-decades-the-number-of-people-without-access-to-electricity-is-set-to-increase-in-2022.
24. ESMAP, “Electricity.”
25. IEA et al., “Tracking SDG 7: The Energy Progress Report” (Washington, DC: World Bank, 2023), https://www.iea.org/reports/tracking-sdg7-the-energy-progress-report-2023.
26. This analysis groups countries into regions and sub-regions according to classifications designated by the United Nations Statistics Division. Available here.
27. IEA et al.
28. IEA et al.
29. IEA et al.
30. IEA et al.
31. He et al., “Review of Fan-Use Rates in Field Studies and Their Effects on Thermal Comfort, Energy Conservation, and Human Productivity.”
32. Ana Maria Bueno, Antonio Augusto de Paula Xavier, and Evandro Eduardo Broday, “Evaluating the Connection between Thermal Comfort and Productivity in Buildings: A Systematic Literature Review,” Buildings 11, no. 6 (June 2021): 244, https://doi.org/10.3390/buildings11060244.
33. Dhruvak Aggarwal and Shalu Agrawal, “Business Model for Scaling Up Super-Efficient Appliances: A Deep Dive on Ceiling Fans in India” (New Delhi: Council on Energy, Environment and Water, February 14, 2022), https://www.ceew.in/publications/business-model-to-scale-up-energy-efficient-appliances-ceiling-fans-india.
34. PricewaterhouseCoopers Private Limited (PwC), “Indonesia Fan Market Study and Policy Analysis” (2020: CLASP, n.d.), https://www.clasp.ngo/wp-content/uploads/2021/01/Indonesia-Fan-Market-Study-and-Policy-Analysis.pdf.
35. IEA, “The Future of Cooling” (Paris, France, 2018), https://www.iea.org/reports/the-future-of-cooling.
36. Tiago V. de V. Cavalcanti and José Tavares, “Assessing the ‘Engines of Liberation’: Home Appliances and Female Labor Force Participation,” The Review of Economics and Statistics 90, no. 1 (2008): 81–88.
37. Efficiency for Access, “Uses and Impacts of Off-Grid Refrigerators” (Efficiency for Access Coalition, 2022), 17, https://efficiencyforaccess.org/publications/uses-and-impacts-of-off-grid-refrigerators.
38. Richard Lowes et al., “A Policy Toolkit for Global Mass Heat Pump Deployment,” 2022, https://www.raponline.org/knowledge-center/policy-toolkit-global-mass-heat-pump-deployment/.
39. Sylvain Gillaux, “Inside View into the Japanese Heat Pump Market,” REHVA, 2012, 55–56.
40. Heat Pump Centre, “Annex 46: Task 1 Market Overview Country Report Japan” (Sweden: Technology Collaboration Program on Heat Pumping Technologies (TCP-HPT), 2019), https://heatpumpingtechnologies.org/annex46/wp-content/uploads/sites/53/2020/10/hpt-an46-02-04-task-1-counry-report-japan.pdf.
41. Heat Pump Centre, 10.
42. Rewiring America, “25C Residential Energy Efficiency Tax Credit and 25D Residential Clean Energy Tax Credit,” n.d., https://www.rewiringamerica.org/ira-fact-sheets.
43. Gunther Bensch, Marc Jeuland, and Jörg Peters, “Efficient Biomass Cooking in Africa for Climate Change Mitigation and Development,” One Earth 4, no. 6 (June 18, 2021): 879–90, https://doi.org/10.1016/j.oneear.2021.05.015.
44. Clean Cooking Alliance, “Accelerating Clean Cooking as a Nature-Based Climate Solution” (Clean Cooking Alliance, 2022), https://cleancooking.org/reports-and-tools/accelerating-clean-cooking-as-a-nature-based-climate-solution/#:~:text=Accelerating%20Clean%20Cooking%20as%20a%20Nature%2Dbased%20Climate%20Solution%20examines,to%20advancing%20nature%2Dbased%20solutions.
45. IEA, “A Vision for Clean Cooking Access for All” (Paris, France: International Energy Agency, 2023), https://www.iea.org/reports/a-vision-for-clean-cooking-access-for-all.
46. Clean Cooking Alliance, “Accelerating Clean Cooking as a Nature-Based Climate Solution.”
47. Dr. Yifang Zhu et al., “Effects of Residential Gas Appliances on Indoor and Outdoor Air Quality and Public Health in California” (Los Angeles: UCLA Fielding School of Public Health, 2020), https://coeh.ph.ucla.edu/wp-content/uploads/2023/01/Effects-of-Residential-Gas-Appliances-on-Indoor-and-Outdoor-Air-Quality-and-Public-Health-in-California.pdf.
48. Eunice Phillip et al., “Improved Cookstoves to Reduce Household Air Pollution Exposure in Sub-Saharan Africa: A Scoping Review of Intervention Studies,” PLOS ONE 18, no. 4 (April 27, 2023): e0284908, https://doi.org/10.1371/journal.pone.0284908.
49. Josiah L. Kephart et al., “Nitrogen Dioxide Exposures from LPG Stoves in a Cleaner-Cooking Intervention Trial,” Environment International 146 (January 1, 2021): 106196, https://doi.org/10.1016/j.envint.2020.106196.
50. Prabhakar Yadav, Peter J. Davies, and Samuel Asumadu-Sarkodie, “Fuel Choice and Tradition: Why Fuel Stacking and the Energy Ladder Are out of Step?,” Solar Energy 214 (January 15, 2021): 491–501, https://doi.org/10.1016/j.solener.2020.11.077.
51. Martin Price, Melinda Barnard-Tallier, and Karin Troncoso, “Stacked: In Their Favour? The Complexities of Fuel Stacking and Cooking Transitions in Cambodia, Myanmar, and Zambia,” Energies 14, no. 15 (January 2021): 4457, https://doi.org/10.3390/en14154457.
52. Caroline A. Ochieng et al., “Household Perspectives on Cookstove and Fuel Stacking: A Qualitative Study in Urban and Rural Kenya,” Energy for Sustainable Development 59 (December 1, 2020): 151–59, https://doi.org/10.1016/j.esd.2020.10.002.
53. World Health Organization (WHO), “Proportion of Population with Primary Reliance on Fuels and Technologies for Cooking, by Fuel Type (%),” THE GLOBAL HEALTH OBSERVATORY, July 28, 2022, https://www.who.int/data/gho/data/indicators/indicator-details/GHO/proportion-of-population-with-primary-reliance-on-fuels-and-technologies-for-cooking-by-fuel-type.
54. Hadi Farabi-Asl, “Energy Challenges for Clean Cooking in Asia, the Background, and Possible Policy Solutions” (Asian Development Bank, September 25, 2019), Bangladesh, China, People’s Republic of, India, Indonesia, Japan, Pakistan, https://www.adb.org/publications/energy-challenges-clean-cooking-asia.
55. Khizar Abbas et al., “Do Socioeconomic Factors Determine Household Multidimensional Energy Poverty? Empirical Evidence from South Asia,” Energy Policy 146 (November 1, 2020): 111754, https://doi.org/10.1016/j.enpol.2020.111754.
56. Efficiency for Access, “Solar Water Pump Outlook 2019: Global Trends and Market Opportunities.”
57. While there are global datasets of un-irrigated land area (see: Food and Agriculture Organization of the United Nations (FAO), “AQUASTAT”, https://www.fao.org/faostat/en/#data/WCAD), it is challenging to estimate the sufficiency of rainfall and the number of smallholder farmers that would benefit from a water pump without detailed market study, hence the more limited data for this appliance.
58. CLASP and Dalberg, “CLASP Solar Water Pump Market Sizing,” Excel spreadsheet, May 9, 2019.
59. “Solar Water Pump Technology Roadmap,” CLASP, accessed July 19, 2023, https://www.clasp.ngo/research/all/solar-water-pump-technology-roadmap-2/.
60. “Comparing the Costs and Benefits of Solar Water Pumps vs. Traditional Pumps – RPS Solar Pumps | America’s #1 Solar Well Pumps,” accessed July 18, 2023, https://www.rpssolarpumps.com/uncategorized/comparing-the-costs-and-benefits-of-solar-water-pumps-vs-traditional-pumps/.
61. Nimay Giri et al., “Efficiency of Solar Powered Water Pumps for Rural Farmers in Odisha; India,” PalArch’s Journal of Archaeology of Egypt/ Egyptology 17 (December 20, 2020): 2215–24.
62. Lelin Thouthang and Rohin Kumar, “Can India’s 30m Grid/Diesel Irrigation Pumps Go Solar?,” Energy Post (blog), July 1, 2019, https://energypost.eu/can-indias-30m-grid-diesel-irrigation-pumps-go-solar/.
63. Ministry of New and Renewable Energy, “Objectives of PM-KUSUM” (Ministry of New and Renewable Energy), accessed June 15, 2023, https://pib.gov.in/pib.gov.in/Pressreleaseshare.aspx?PRID=1843536.
64. Ministry of New and Renewable Energy, “Pradhan Mantri Kisan Urja Suraksha Evam Utthan Mahabhiyaan,” July 29, 2023, https://pmkusum.mnre.gov.in/landing.html.
65. Digital divide refers to the gap between those that have and do not have access to modern information and communications technology, like a computer and the internet.
66. Danny DeBare, “The Use and Impacts of Solar TVs,” 60 Decibels, January 1, 2020, https://60decibels.com/insights/the-use-and-impacts-of-solar-tvs/.
67. Won Young Park and Amol A. Phadke, “Adoption of Energy-Efficient Televisions for Expanded off-Grid Electricity Service,” Development Engineering 2 (January 1, 2017): 107–13, https://doi.org/10.1016/j.deveng.2017.07.002.
68. This analysis groups countries into regions and sub-regions according to classifications designated by the United Nations Statistics Division. Available here.
69. Jeremy Maggs, “Radio Is as Popular as Ever,” Financial Mail, November 11, 2021, https://www.businesslive.co.za/redzone/news-insights/2021-11-11-radio-is-as-popular-as-ever/.
70. Naomi Forman-Katz, “For World Radio Day, Key Facts about Radio Listeners and the Radio Industry in the U.S.,” Pew Research Center (blog), accessed June 15, 2023, https://www.pewresearch.org/short-reads/2023/02/13/for-world-radio-day-key-facts-about-radio-listeners-and-the-radio-industry-in-the-u-s/.
71. “Households with a Radio – ITU DataHub,” accessed April 4, 2023, https://datahub.itu.int/data/?i=8941; US Agency for International Development (USAID), “STATcompiler: The DHS Program,” accessed April 4, 2023, https://www.statcompiler.com/en/.
72. Gloria Dickie, “Climate Change Made Eastern Canada Wildfires Twice as Likely, Scientists Say | Reuters,” Reuters, August 22, 2023, https://www.reuters.com/business/environment/climate-change-made-eastern-canada-wildfires-twice-likely-scientists-say-2023-08-22/.
73. Laura Paddison, “Catastrophic Drought Made 100 Times More Likely by Climate Change, Analysis Finds,” CNN, April 27, 2023, https://www.cnn.com/2023/04/27/africa/drought-horn-of-africa-climate-change-intl/index.html.
74. Raymond Zhong, “In a First Study of Pakistan’s Floods, Scientists See Climate Change at Work,” The New York Times, September 15, 2022, sec. Climate, https://www.nytimes.com/2022/09/15/climate/pakistan-floods-global-warming.html.
75. Nathan Rott, “U.S., European Heat Waves ‘virtually Impossible’ without Climate Change, Study Finds,” NPR, July 25, 2023, sec. Climate, https://www.npr.org/2023/07/25/1189837347/u-s-european-heat-waves-virtually-impossible-without-climate-change-new-study-fi.
76. WHO, “Quantitative Risk Assessment of the Effects of Climate Change on Selected Causes of Death, 2030s and 2050s” (World Health Organization, 2014), https://apps.who.int/iris/handle/10665/134014.
77. Data were sourced from Sustainable Energy for All’s Chilling Prospects: Tracking Sustainable Cooling for All report. To estimate cooling access gaps, we used the percentage of the population at high risk due to a lack of cooling access. High risk populations were defined as households that do not have access to electricity, live below the poverty line, live in buildings with poor ventilation and construction, do not have access to a refrigerator and agricultural and medical cold chains. This population largely include the rural and urban poor.
78. A Heat Index is a measure of how it feels once humidity is factored in with air temperature.
79. Sourav Mukherjee, Ashok Mishra, and Kevin E. Trenberth, “Climate Change and Drought: A Perspective on Drought Indices,” Current Climate Change Reports 4, no. 2 (June 1, 2018): 145–63, https://doi.org/10.1007/s40641-018-0098-x.
80. Iain R. Lake et al., “Climate Change and Food Security: Health Impacts in Developed Countries,” Environmental Health Perspectives 120, no. 11 (November 2012): 1520–26, https://doi.org/10.1289/ehp.1104424.
81. While some solar water pumps will replace diesel pumps (e.g., there are over 20 million off-grid smallholder farmers in India and 8.8 million diesel pumps), they would still improve resilience by increase incomes.
82. CLASP and Dalberg, “CLASP Solar Water Pump Market Sizing.”
83. FAO and IRENA, Renewable Energy for Agri-Food Systems: Towards the Sustainable Development Goals and the Paris Agreement (Rome, Italy: IRENA and FAO, 2021), https://doi.org/10.4060/cb7433en.
84. SEforALL, “Chilling Prospects.”
85. Data only available for the following countries: India, Ethiopia, Nigeria, Uganda, Kenya, Mozambique, Malawi, Sierra Leone, Rwanda, Zambia, Zimbabwe, and the United Republic of Tanzania. Solar water pump access rates were modeled by CLASP. Agricultural risk data are sourced from: Meza, Isabel, Stefan Siebert, Petra Döll, Jürgen Kusche, Claudia Herbert, Ehsan Eyshi Rezaei, Hamideh Nouri, et al. “Global-Scale Drought Risk Assessment for Agricultural Systems.” Natural Hazards and Earth System Sciences 20, no. 2 (March 2, 2020): 695–712. https://doi.org/10.5194/nhess-20-695-2020.